GATE 2025 ST – Question 5
General Aptitude · Quantitative Aptitude: Data Interpretation, Arithmetic and Number Computation · 1 mark · Multiple choice
A bag contains Violet V,Yellow Y,Red R,Green G balls. Their counts satisfy Y+2V=50,V+G=50,Y+R=50,V+2R=50. Which shown pie chart represents the bag?
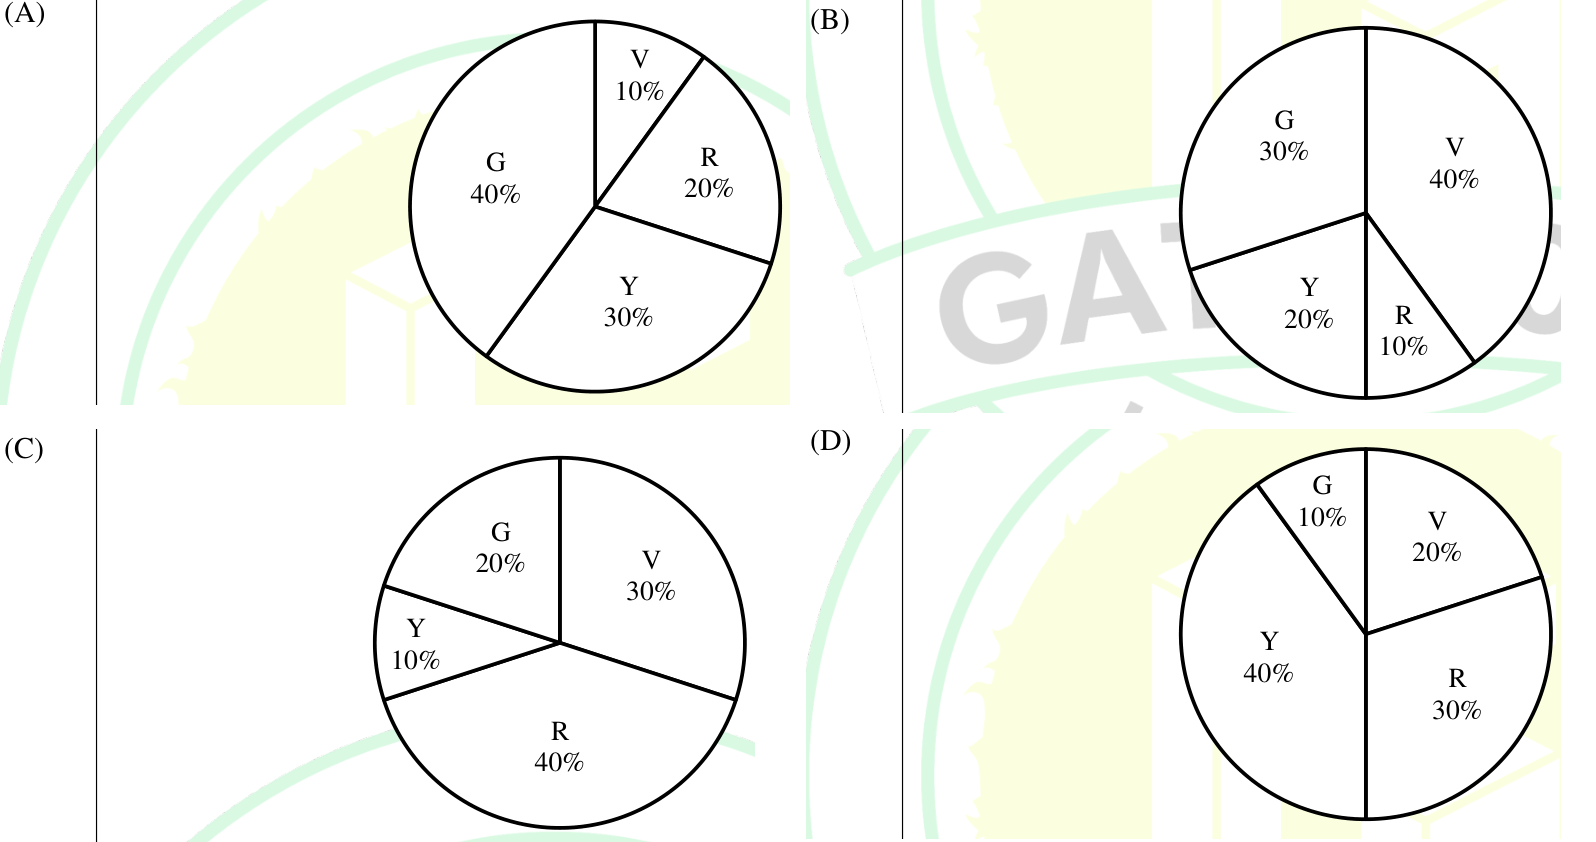
- Option A in the figure
- Option B in the figure
- Option C in the figure
- Option D in the figure
Practise this question in The GATE Grind →
Show answer and explanation
Correct answer: (A) Option A in the figure
Explanation
From Y=50−2V and Y+R=50, R=2V. Then V+2R=5V=50 gives V=10,R=20,Y=30,G=40. Total=100, so the percentages are V10%,R20%,Y30%,G40%, matching **A**.
More Quantitative Aptitude: Data Interpretation, Arithmetic and Number Computation questions
- GATE 2025 ST Q9 – Variety P potatoes cost ₹800 per 5 kg; Q costs ₹800 per 4 kg. A mixture sells at ₹192/kg…
- GATE 2024 ST Q2 – Two wizards independently try mixing all four elements water,air,fire,earth in every…
- GATE 2024 ST Q3 – Of 10000 students,1500 like neither their core nor other branches. The number liking core…
- GATE 2024 ST Q5 – In the sequence 6,9,14,x,30,41, find a possible x.
- GATE 2024 ST Q7 – Two items sell at the same price, one at 10% profit and the other at 10% loss. Find the…
- GATE 2024 ST Q8 – The pie charts show generation shares in 2007 and 2023. Renewable sources are…
All Quantitative Aptitude: Data Interpretation, Arithmetic and Number Computation questions →