GATE 2021 PH – Question 11
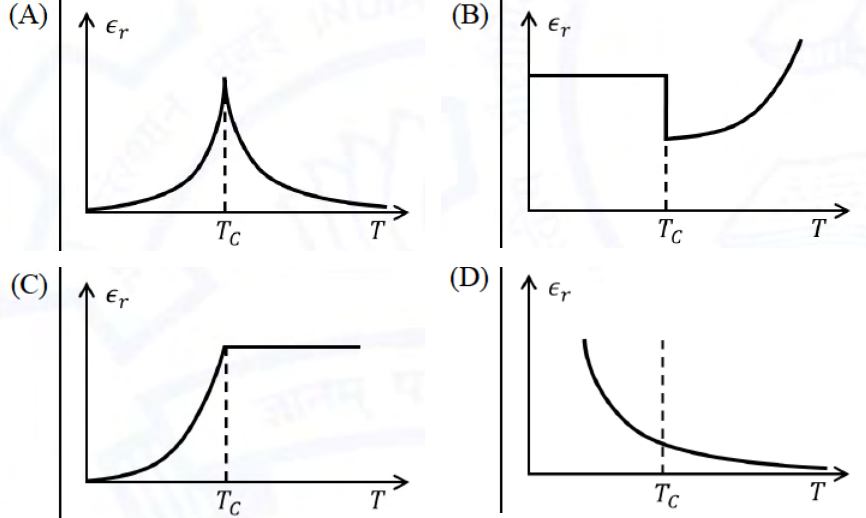
Choose the graph that best describes the variation of dielectric constant $\epsilon_r$ with temperature $T$ in a ferroelectric material. $T_C$ is the Curie temperature.
Practise this question in The GATE Grind →
Show answer and explanation
Correct answer: (A) Figure (A)
Explanation
The dielectric response becomes very large near the ferroelectric transition. Above $T_C$, the Curie–Weiss law gives $\epsilon_r\propto1/(T-T_C)$, so the dielectric constant decreases as the temperature moves away from the transition. Below $T_C$ it rises toward the transition. The peak at $T_C$ and decay on either side correspond to A.