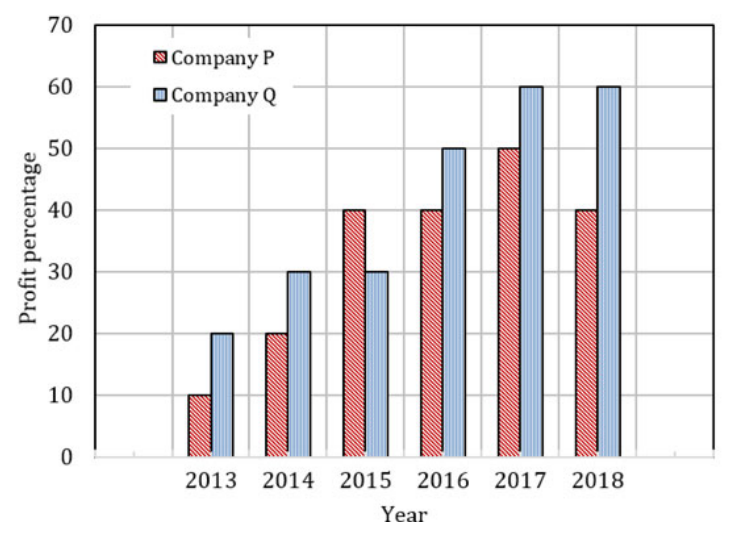
The chart gives annual profit percentages for companies P and Q during2013–2018. Both invest the same fixed amount each year. Find the ratio of total revenue P:Q.
P’s profit percentages total10+20+40+40+50+40=200; Q’s total20+30+30+50+60+60=250. Revenue includes the investment base each year, so totals are proportional to600+200 and600+250. Ratio800:850=16:17, B.
More Quantitative Aptitude: Data Interpretation, Arithmetic and Number Computation questions
GATE 2021 XH2 Q8– Farm P has65 hens,91 ducks and169 goats. Farm Q has416 animals in the ratio…
GATE 2021 XH2 Q9– There are10,000 executives. The pie chart gives company shares. Ratios of executives with…
GATE 2021 XH5 Q8– Farm P has65 hens,91 ducks and169 goats. Farm Q has416 animals in the ratio…
GATE 2021 XH5 Q9– There are10,000 executives. The pie chart gives company shares. Ratios of executives with…
GATE 2026 MN Q4– The 2nd of June is a Thursday in a certain year. Which day of the week is the 3rd of July…
GATE 2025 MN Q3– An electricity utility company charges ₹ 7 per kWh (kilo watt-hour). If a 40-watt desk…