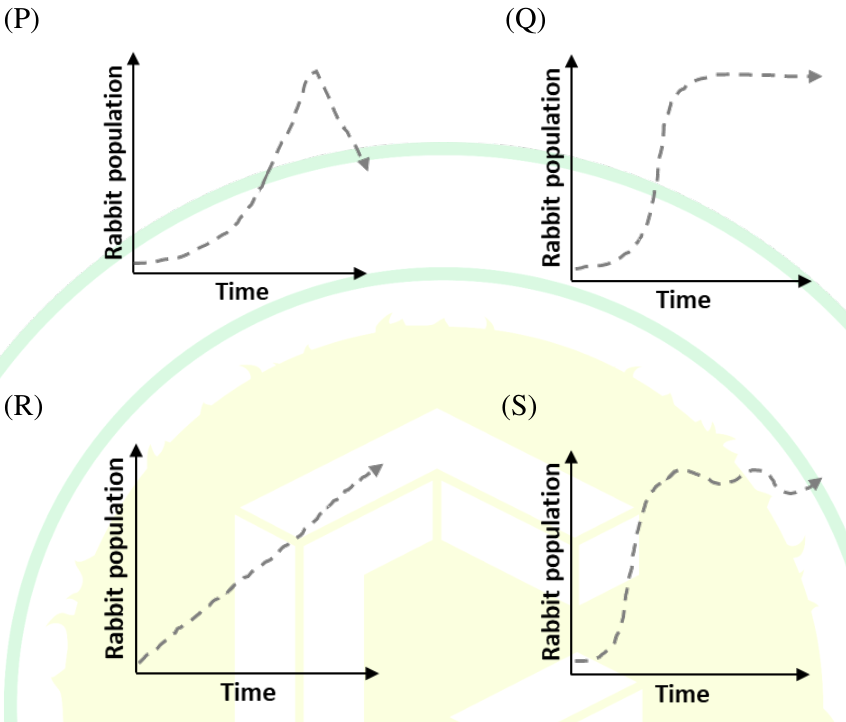
If rabbits are introduced in an isolated grassland for the first time, which of the following growth curves (shown using dashed line) is/are theoretically possible population dynamics over time? (P) (Q) (R) (S)
The source accepts P, Q and S (A, B, D), representing theoretically possible population responses under differing resource limitations and feedback. Population establishment can show an approach to carrying capacity, transient oscillations or overshoot-related decline; a particular trajectory is not uniquely determined merely by introducing rabbits. Use the plotted axes and dashed curves to distinguish the excluded R profile rather than assuming every introduction gives unlimited exponential growth.