GATE 2024 XL — all source sections – Question 12
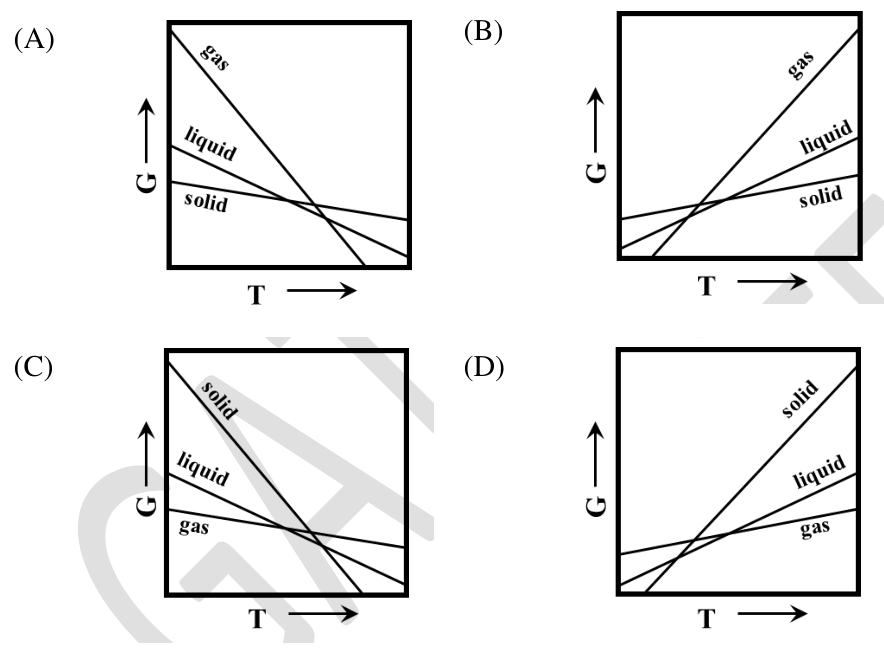
Which graph correctly represents the variation of Gibbs free energy G with temperature T at constant pressure?
Practise this question in The GATE Grind →
Show answer and explanation
Correct answer: (A) Graph A in the figure
Explanation
At constant pressure, dG/dT=−S. Entropy is positive, so each phase has a negative slope. Since Sgas > Sliquid > Ssolid, the gas line has the steepest negative slope and the solid line the shallowest. Only A has both the correct signs and the correct relative slopes.