GATE 2019 EC – Question 7
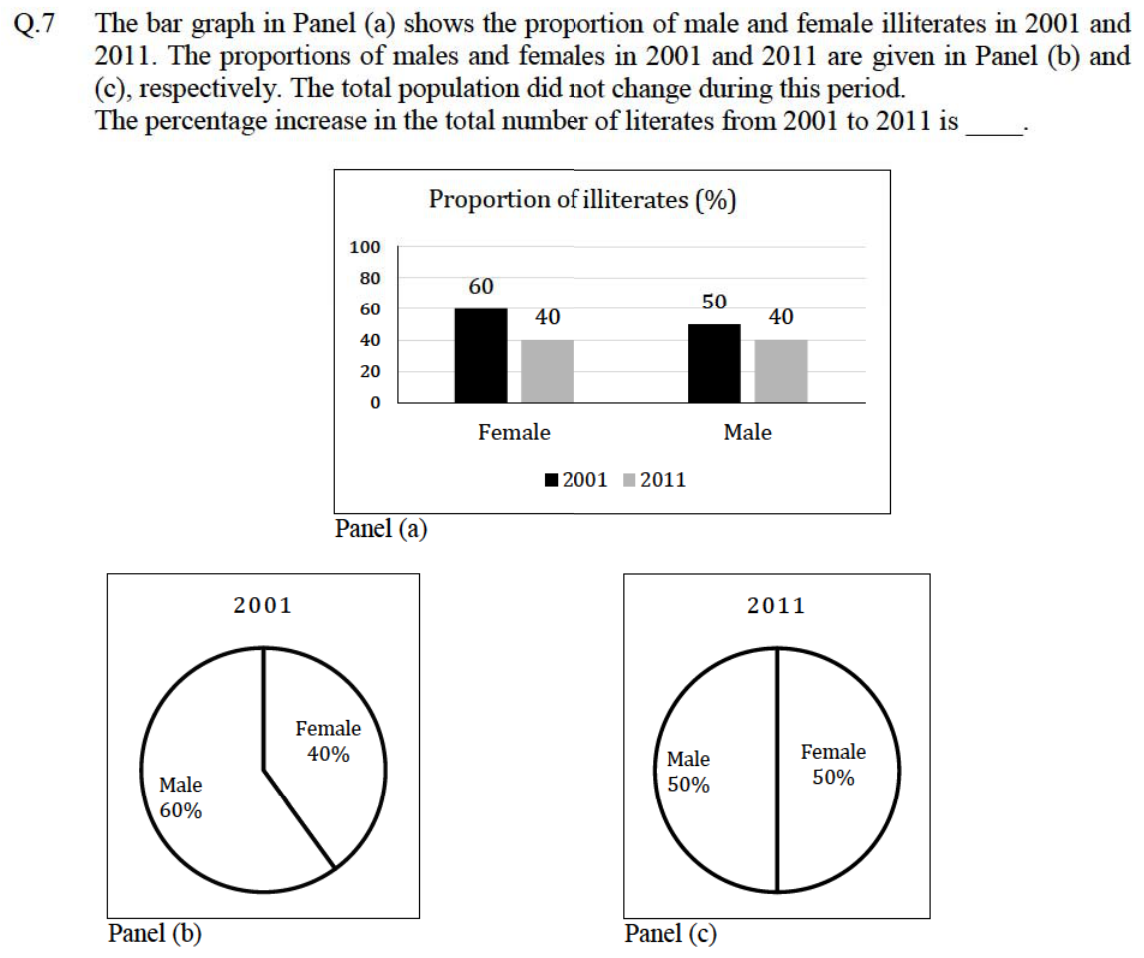
The bar graph in Panel (a) shows the proportion of male and female illiterates in 2001 and 2011. The proportions of males and females in 2001 and 2011 are given in Panel (b) and (c), respectively. The total population did not change during this period.
The percentage increase in the total number of literates from 2001 to 2011 is ________.
Practise this question in The GATE Grind →
Show answer and explanation
Correct answer: (A) 30.43
Explanation
Take a population of 100. In 2001 there were 60 males (50% illiterate, so 30 literate) and 40 females (60% illiterate, so 16 literate): 46 literates. In 2011 there were 50 males (40% illiterate, 30 literate) and 50 females (40% illiterate, 30 literate): 60 literates. The increase is $\frac{60-46}{46}=30.43\%$.