GATE 2019 EC – Question 16
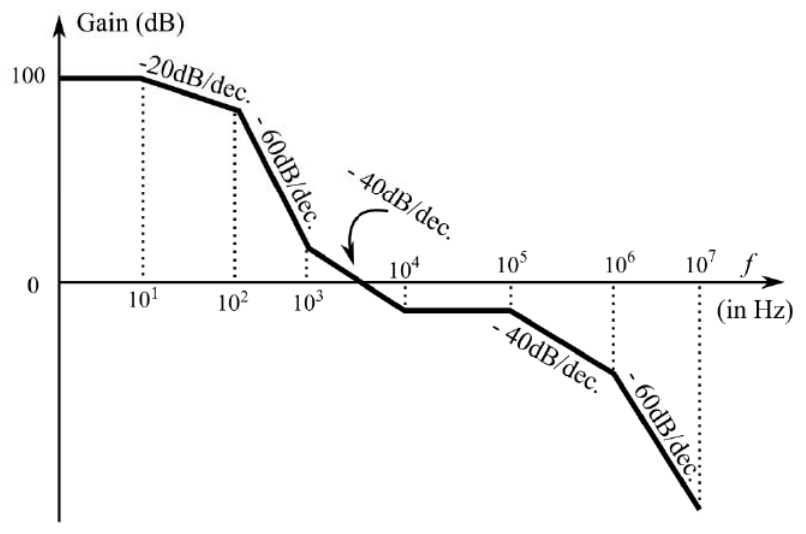
For an LTI system, the Bode plot for its gain is as illustrated in the figure shown. The number of system poles $N_p$ and the number of system zeros $N_z$ in the frequency range $1\ \text{Hz}\le f\le10^7\ \text{Hz}$ is
Practise this question in The GATE Grind →
Show answer and explanation
Correct answer: (B) $N_p=6,\ N_z=3$
Explanation
Each $-20$ dB/dec change in slope is a pole and each $+20$ dB/dec change is a zero. Reading the plot, the slope falls by $20$ at $10$ Hz (1 pole), by $40$ at $10^2$ Hz (2 poles), rises by $20$ and then $40$ (3 zeros) to return to zero slope, and falls again by $40$ and $20$ at the high frequencies (3 more poles). That is $6$ poles and $3$ zeros.