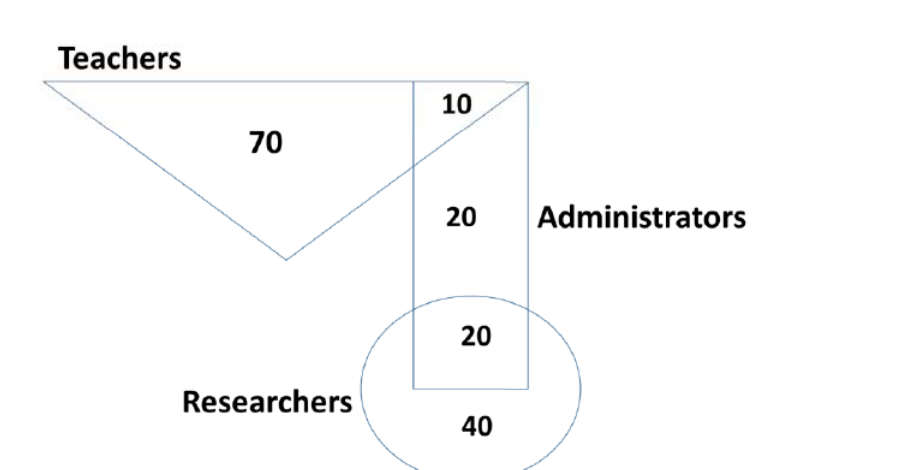
Teachers are represented by a triangle, researchers by a circle, and administrators by a rectangle. From the diagram, the percentage of the people who are administrators lies in which range?
We are sorry we couldn't write detailed soluition for this, we are working on it!, please consider asking your own AI, its just 2-3 clicks with very minimum effort
More Quantitative Aptitude: Data Interpretation, Arithmetic and Number Computation questions
GATE 2019 CH Q9– A college has three student clubs. There are 60 students only in Drama, 80 only in Dance,…
GATE 2019 IN Q7– In a country with a population of 1400 million, 70% own mobile phones; 294 million owners…
GATE 2019 IN Q9– Two trains leave the same point at 7 AM, traveling in opposite directions at 80 km/h north…
GATE 2019 MA Q7– In a country with a population of 1400 million, 70% own mobile phones; 294 million owners…
GATE 2019 MA Q9– Two trains leave the same point at 7 AM, traveling in opposite directions at 80 km/h north…
GATE 2019 PH Q7– In a country with a population of 1400 million, 70% own mobile phones; 294 million owners…