GATE 2020 AR – Question 10
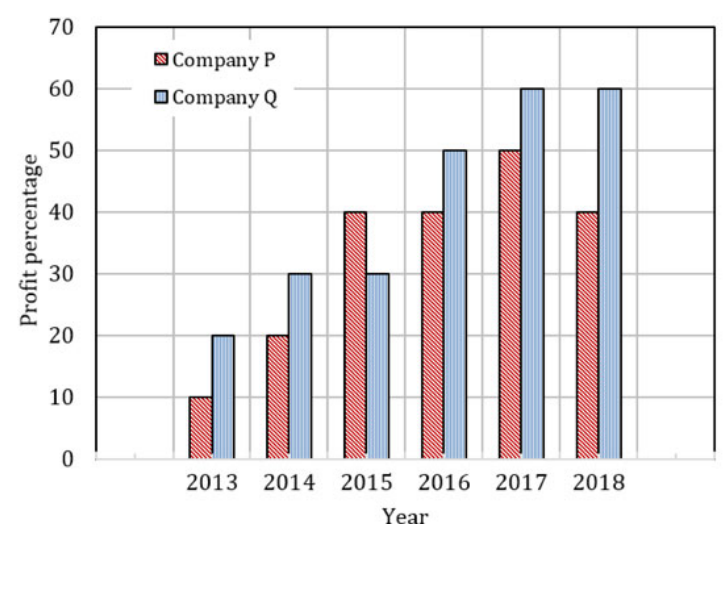
The chart shows profit percentages of companies P and Q during 2013–2018. Both invest a fixed, equal amount every year. Find the ratio of P’s total revenue to Q’s total revenue for these years.
Practise this question in The GATE Grind →
Show answer and explanation
Correct answer: (D) 17:16
Explanation
We are sorry we couldn't write detailed soluition for this, we are working on it!, please consider asking your own AI, its just 2-3 clicks with very minimum effort
More Quantitative Aptitude: Data Interpretation, Arithmetic and Number Computation questions
- GATE 2020 XE — all source sections Q8
- GATE 2020 XE — all source sections Q10
- GATE 2020 XL — all source sections Q8
- GATE 2020 XL — all source sections Q10
- GATE 2022 XH-C6 (Sociology) Q3
- GATE 2023 XH-C6 (Sociology) Q9
All Quantitative Aptitude: Data Interpretation, Arithmetic and Number Computation questions →