GATE 2018 XL — all source sections – Question 9
Which of the following functions describe the graph shown in the below figure?
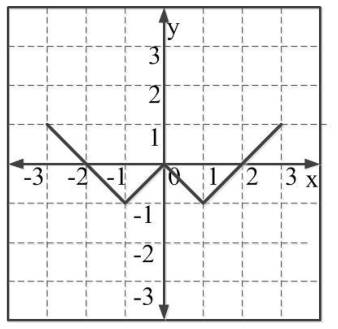
Practise this question in The GATE Grind →
Show answer and explanation
Correct answer: (B) 𝑦= ||𝑥| −1| −1
Explanation
We are sorry we couldn't write detailed soluition for this, we are working on it!, please consider asking your own AI, its just 2-3 clicks with very minimum effort