GATE 2016 EE – Question 40
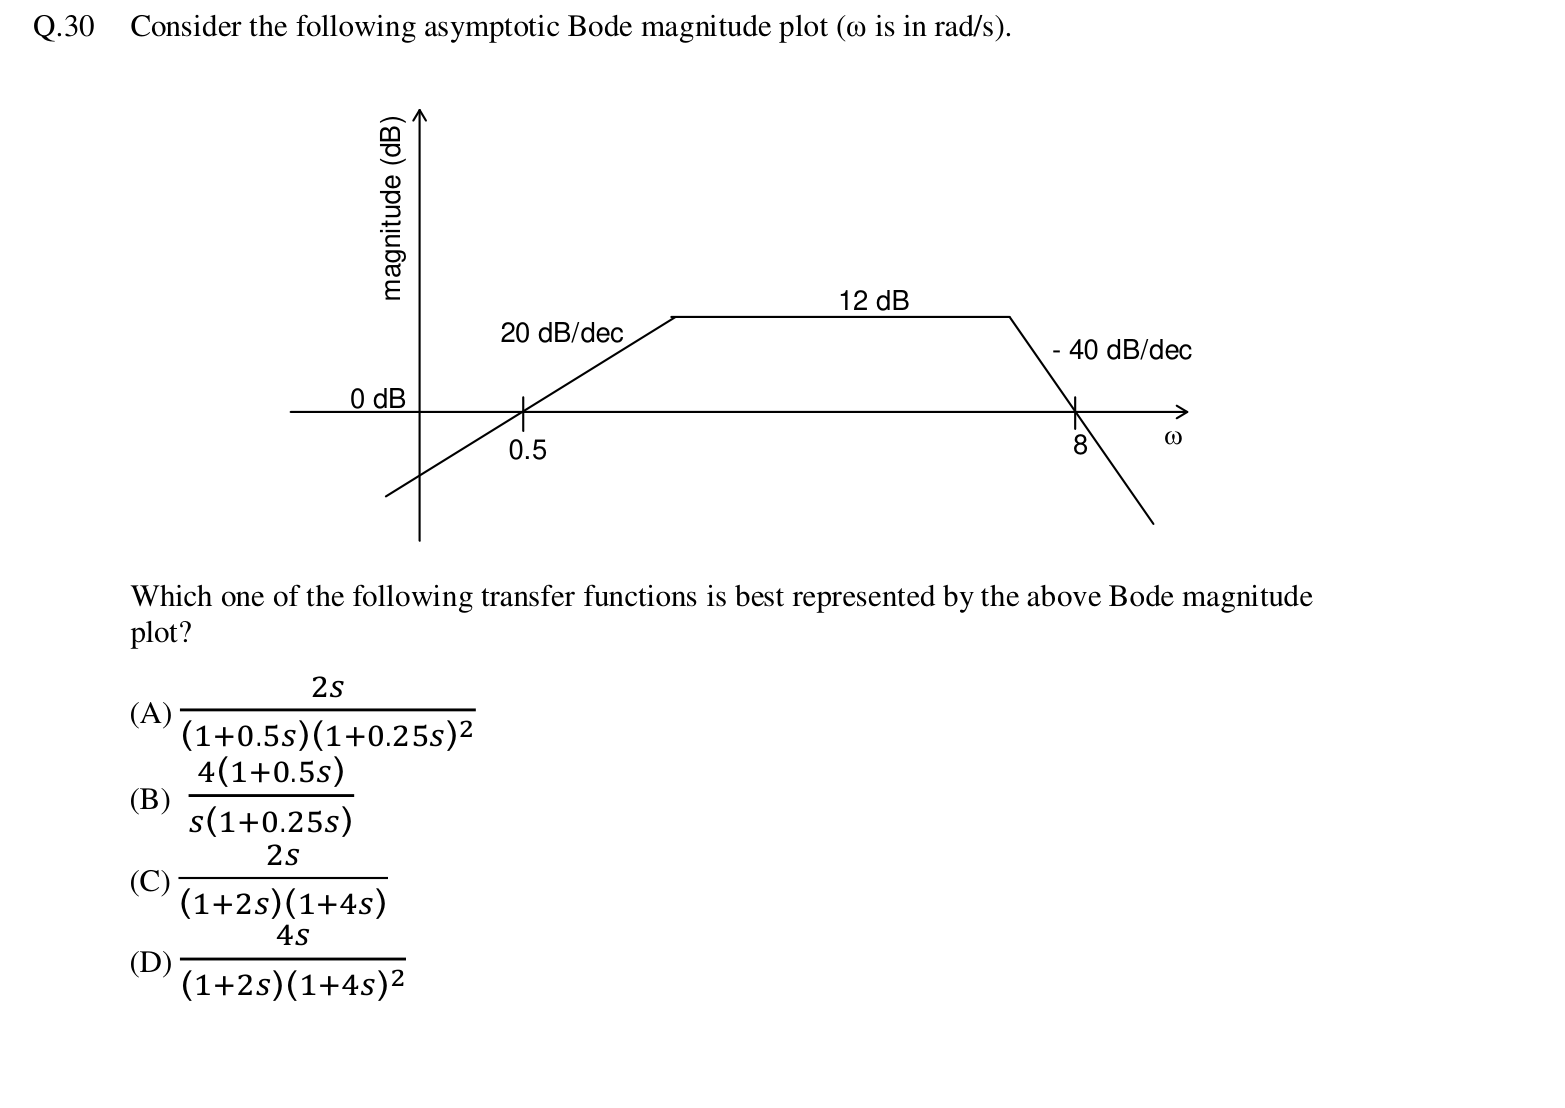
Consider the following asymptotic Bode magnitude plot ($\omega$ is in rad/s).
[Figure: A Bode magnitude plot. The slope is +20 dB/dec, crossing 0 dB at $\omega = 0.5$, then the plot is flat at 12 dB, and finally the slope is -40 dB/dec, crossing 0 dB at $\omega = 8$.]
Which one of the following transfer functions is best represented by the above Bode magnitude plot?
Practise this question in The GATE Grind →
Show answer and explanation
Correct answer: (A) $\frac{2s}{(1 + 0.5s)(1 + 0.25s)^2}$
Explanation
Option A has a zero at the origin, so it rises at +20 dB/dec and equals 1 (0 dB) at $\omega = 0.5$ because $2 \times 0.5 = 1$. The pole at $\omega = 2$ makes the plot flat at $2 \times 2 = 4$, which is 12 dB. The double pole at $\omega = 4$ then gives -40 dB/dec, which drops 12 dB over the factor 2 between 4 and 8, reaching 0 dB at $\omega = 8$. All three features match the plot.