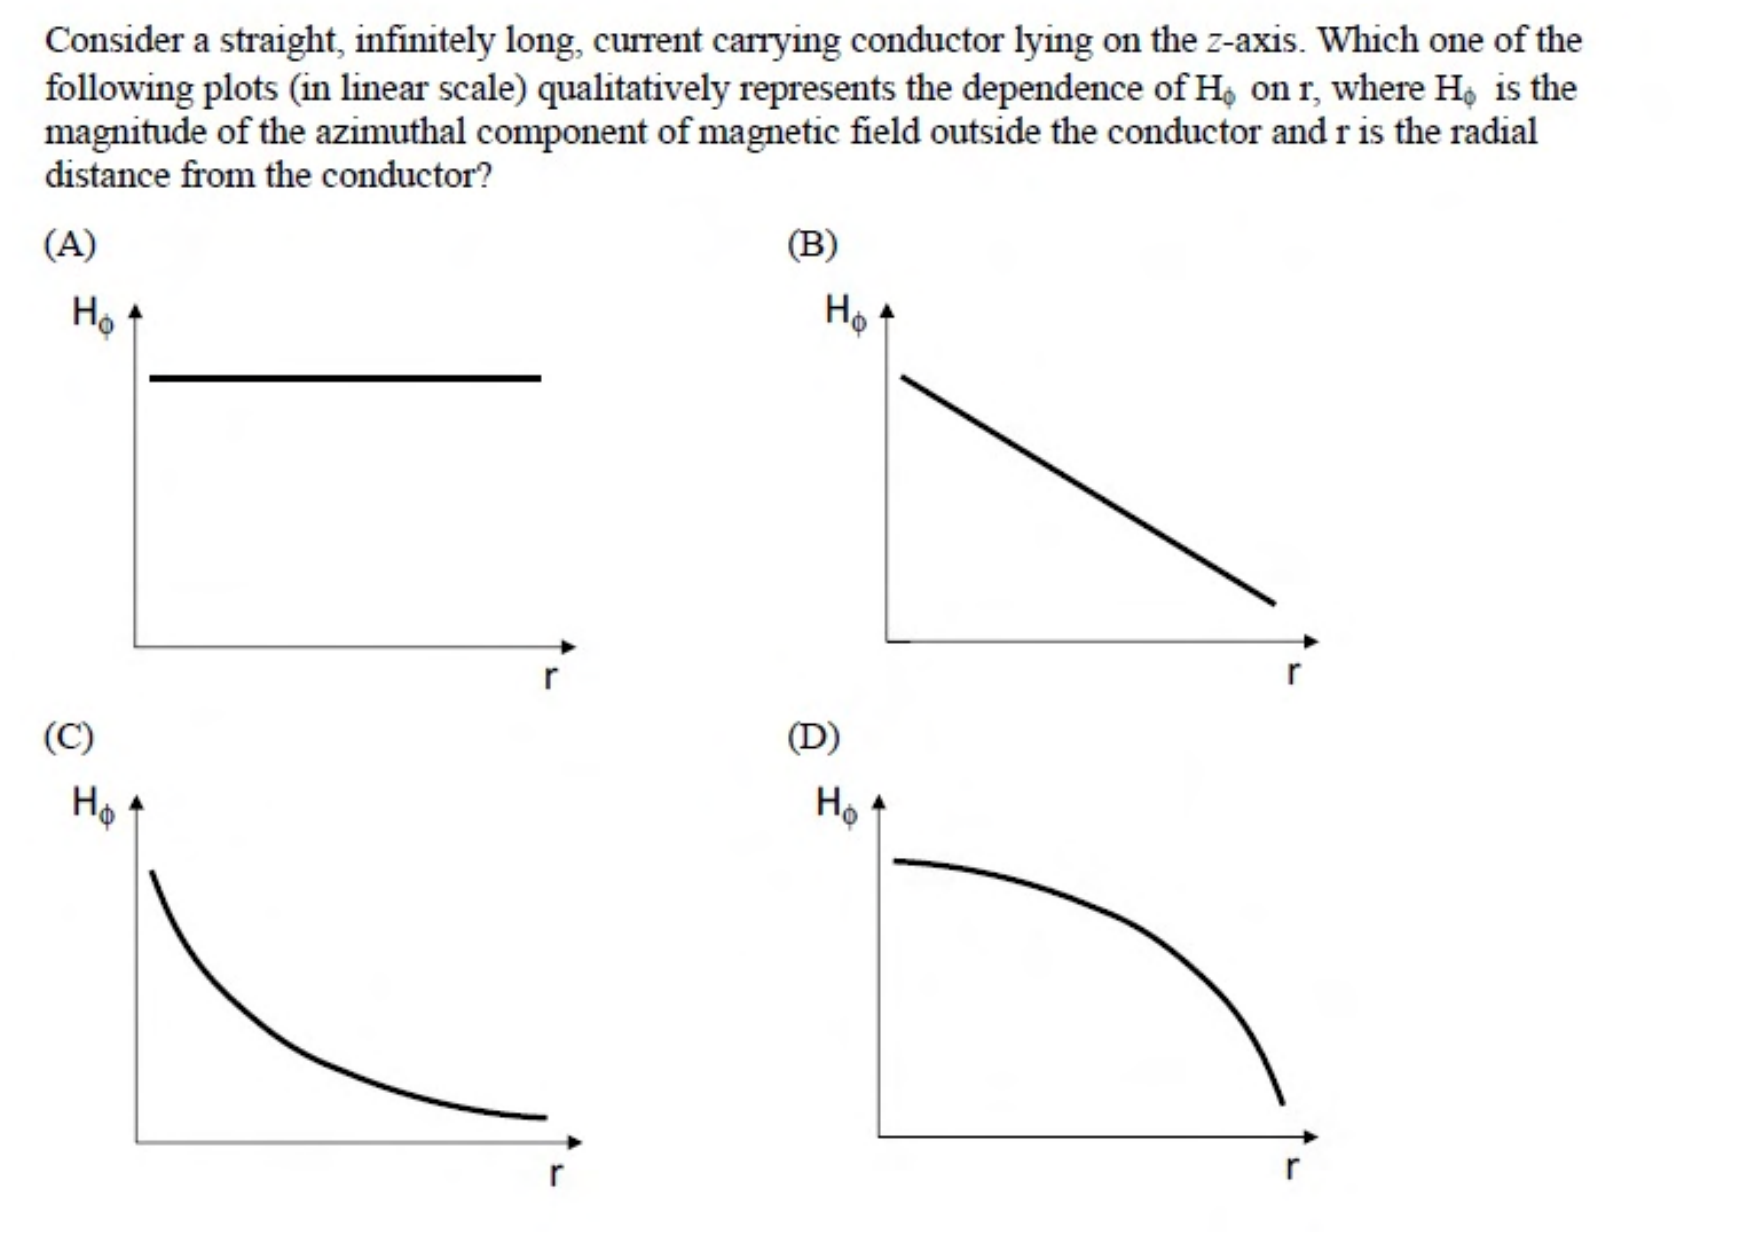
Consider a straight, infinitely long, current carrying conductor lying on the $z$-axis. Which one of the following plots (in linear scale) qualitatively represents the dependence of $H_\phi$ on $r$, where $H_\phi$ is the magnitude of the azimuthal component of magnetic field outside the conductor and $r$ is the radial distance from the conductor?
Correct answer: (C) Plot (C), a curve falling as $\frac{1}{r}$
Explanation
By Ampere's law around a long straight wire carrying current $I$, $H_\phi\,(2\pi r)=I$, so $H_\phi=\dfrac{I}{2\pi r}$ outside the conductor.
The field therefore falls as $1/r$: large close to the wire and decreasing ever more slowly farther out, never reaching zero. That hyperbola-shaped curve is plot (C). A constant (A), a straight line (B) or a curve that is flat and then drops (D) would not match $1/r$.
More Maxwell's Equations questions
GATE 2014 EC (EC1) Q35– A point charge +q is distance d from an infinite grounded metal plate in a medium of…
GATE 2014 EC (EC3) Q64– The region shown contains a perfectly conducting half-space and air. Surface current is K…
GATE 2014 EC (EC4) Q63– The one-dimensional electric field between A and B is shown. Their electrostatic…
GATE 2014 EC (EC4) Q65– E=-(2y3-3yz2) x-(6xy2-3xz2) y+6xyz z is described as the electric field in a source-free…
GATE 2017 EC (EC2) Q34– Two conducting spheres S1 and S2, of radii a and b with b>a, are far apart and connected…
GATE 2017 EC (EC2) Q63– An electron q1 moves in free space at 105 m/s toward a stationary electron q2 far away.…