GATE 2015 EE – Question 34
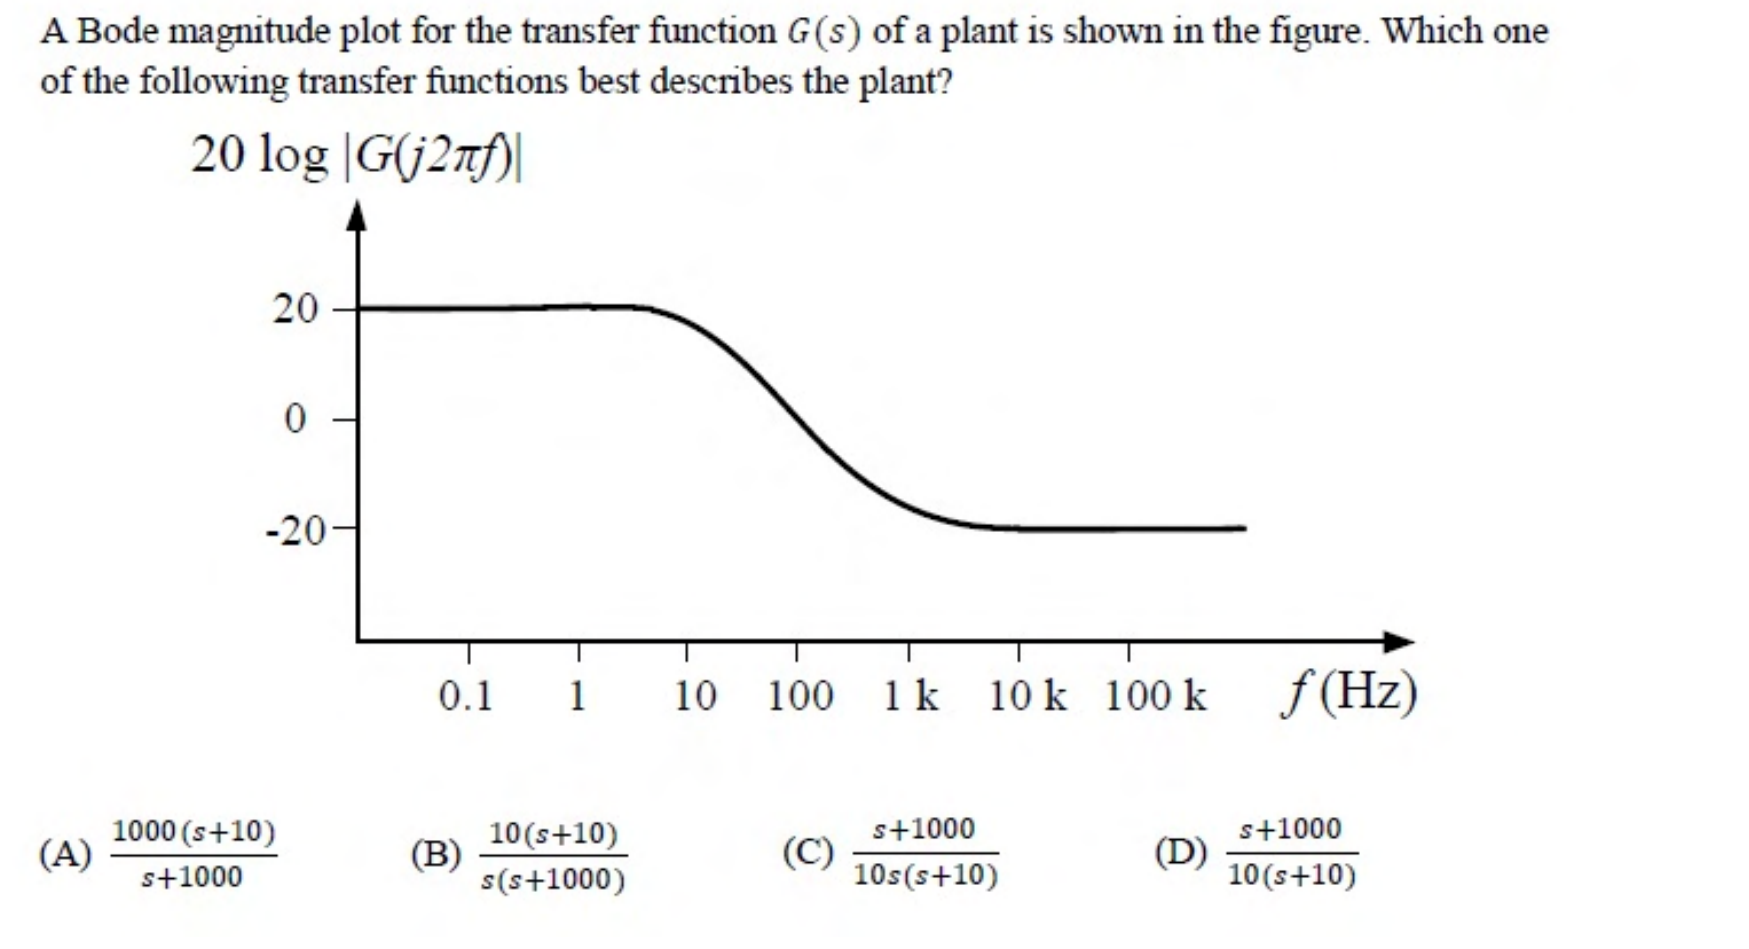
A Bode magnitude plot for the transfer function $G(s)$ of a plant is shown in the figure. Which one of the following transfer functions best describes the plant?
Practise this question in The GATE Grind →
Show answer and explanation
Correct answer: (D) $\frac{s + 1000}{10(s + 10)}$
Explanation
The low-frequency gain is 20 dB, which is 10, and the high-frequency gain is $-20$ dB, which is 0.1. Option D at $s \to 0$ gives $\frac{1000}{100} = 10$ and at $s \to \infty$ gives $\frac{1}{10} = 0.1$. Its pole at 10 starts the drop and its zero at 1000 ends it, which matches the plot.