GATE 2024 ME – Question 17
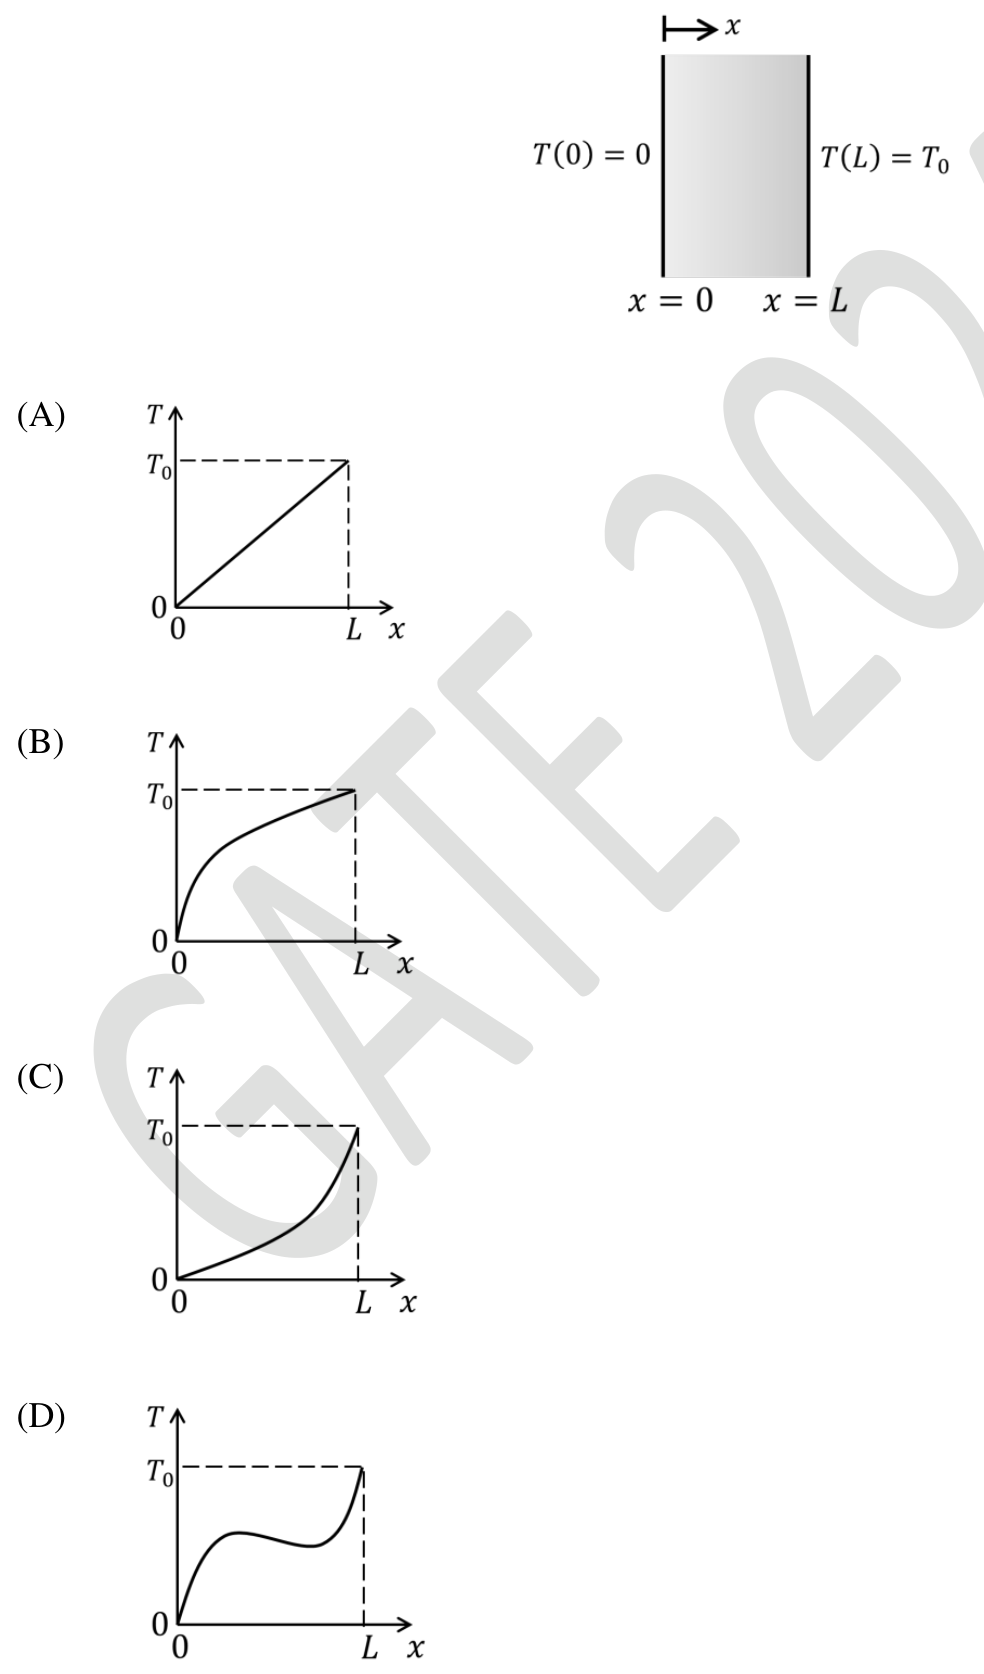
A plane, solid slab of thickness $L$, shown in the figure, has thermal conductivity $k$ that varies with the spatial coordinate $x$ as $k = A + Bx$, where $A$ and $B$ are positive constants ($A > 0$, $B > 0$). The slab walls are maintained at fixed temperatures of $T(x = 0) = 0$ and $T(x = L) = T_0 > 0$. The slab has no internal heat sources. Considering one-dimensional heat transfer, which one of the following plots qualitatively depicts the steady-state temperature distribution within the slab?
Practise this question in The GATE Grind →
Show answer and explanation
Correct answer: (B) Option B in the figure
Explanation
With no heat source the heat flux $q = -k\frac{dT}{dx}$ is the same at every section. So $\frac{dT}{dx} = -\frac{q}{A + Bx}$, and its magnitude falls as $x$ increases because the conductivity grows. The temperature therefore rises steeply near $x = 0$, where the conductivity is lowest, and flattens towards $x = L$. That is the concave curve in plot B.