GATE 2024 CE (CE1) – Question 8
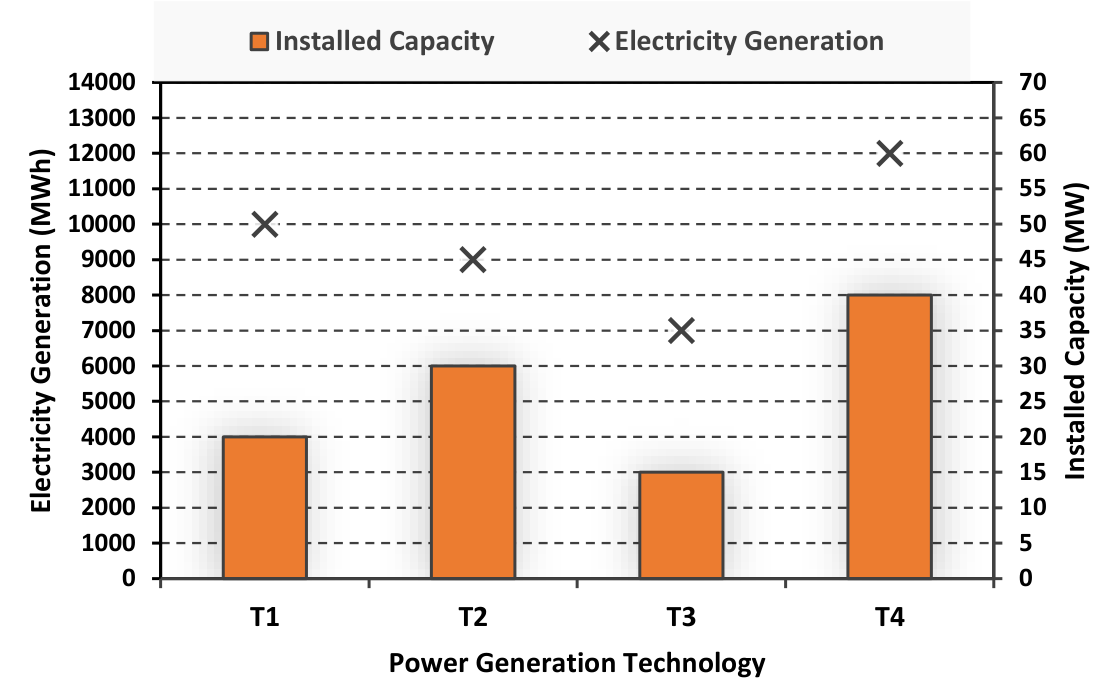
The chart given below compares the Installed Capacity (MW) of four power generation technologies, T1, T2, T3, and T4, and their Electricity Generation (MWh) in a time of 1000 hours (h).
[Figure: a bar and marker chart. The bars (installed capacity, read on the right-hand axis in MW) are 20 MW for T1, 30 MW for T2, 15 MW for T3 and 40 MW for T4. The markers (electricity generation, left-hand axis in MWh) are 10000 for T1, 9000 for T2, 7000 for T3 and 12000 for T4.]
The Capacity Factor of a power generation technology is: Capacity Factor = $\frac{\text{Electricity Generation (MWh)}}{\text{Installed Capacity (MW)} \times 1000\text{ (h)}}$
Which one of the given technologies has the highest Capacity Factor?
Practise this question in The GATE Grind →
Show answer and explanation
Correct answer: (A) T1
Explanation
The capacity factors are: T1 $\frac{10000}{20 \times 1000} = 0.50$, T2 $\frac{9000}{30 \times 1000} = 0.30$, T3 $\frac{7000}{15 \times 1000} = 0.47$, T4 $\frac{12000}{40 \times 1000} = 0.30$. The highest is T1.