GATE 2023 CH – Question 17
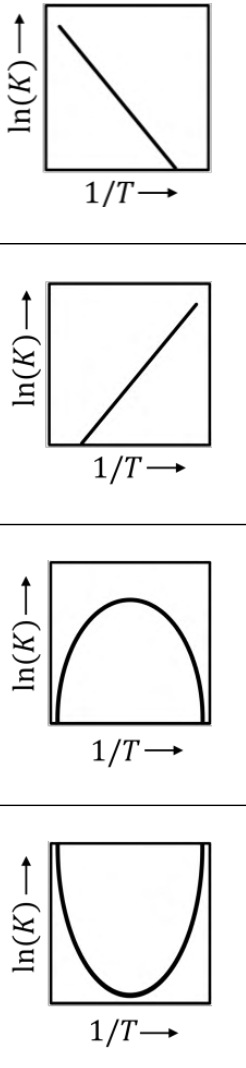
For a reversible endothermic chemical reaction with constant heat of reaction over the operating temperature range, $K$ is the thermodynamic equilibrium constant. Which one of the following figures shows the CORRECT dependence of $K$ on temperature $T$?
Practise this question in The GATE Grind →
Show answer and explanation
Correct answer: (A) Option A in the figure
Explanation
The van't Hoff equation with constant $\Delta H$ gives $\ln K = -\frac{\Delta H}{R}\cdot\frac{1}{T} + $ constant, a straight line. For an endothermic reaction $\Delta H > 0$, so the slope is negative: $\ln K$ falls as $\frac{1}{T}$ increases. That is plot A.