GATE 2024 XH5 (Psychology) – Question 8
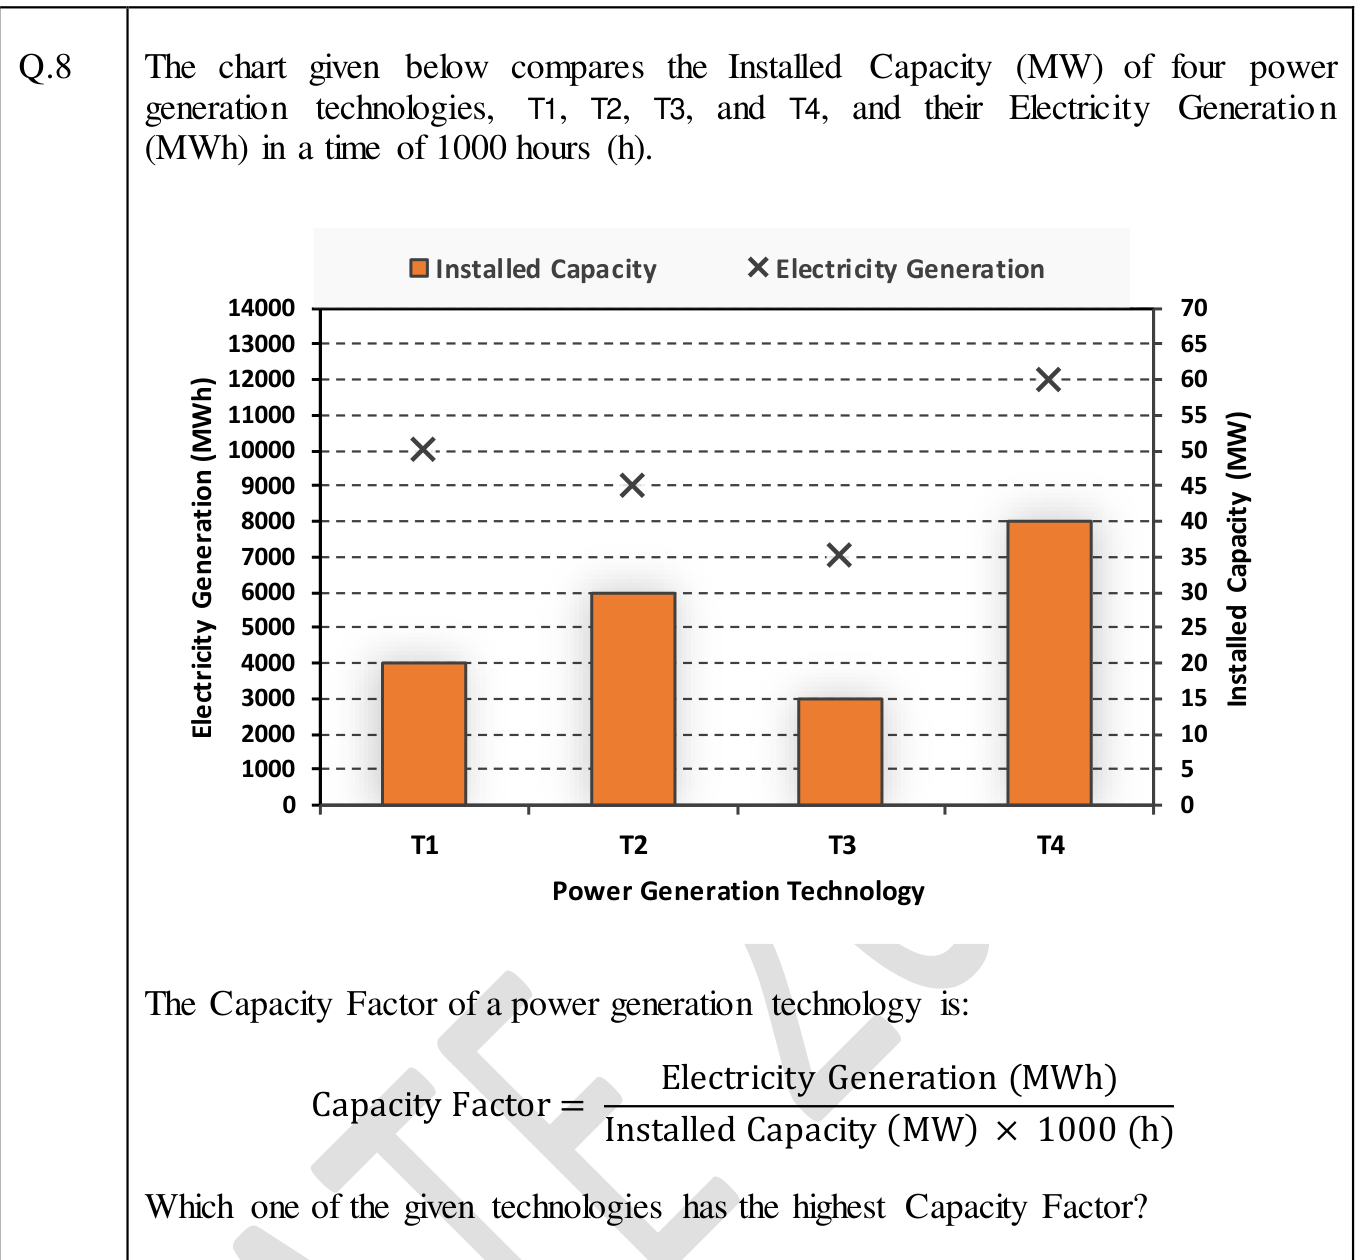
The chart given below compares the Installed Capacity (MW) of four power generation technologies, T1, T2, T3, and T4, and their Electricity Generation (MWh) in a time of 1000 hours (h).
The Capacity Factor of a power generation technology is:
$\text{Capacity Factor} = \frac{\text{Electricity Generation (MWh)}}{\text{Installed Capacity (MW)} \times 1000\ \text{(h)}}$
Which one of the given technologies has the highest Capacity Factor?
Practise this question in The GATE Grind →
Show answer and explanation
Correct answer: (A) T1
Explanation
The bars (read on the right axis) give the capacities 20, 30, 15 and 40 MW and the crosses give the generation 10000, 9000, 7000 and 12000 MWh. The capacity factors are $\frac{10000}{20000} = 0.50$, $\frac{9000}{30000} = 0.30$, $\frac{7000}{15000} \approx 0.47$ and $\frac{12000}{40000} = 0.30$. T1 is the highest.