The GATE Grind

GATE 2025 XH2 (English) – Question 5

General Aptitude · Quantitative Aptitude: Algebra, Geometry and Mensuration · 1 mark · Multiple choice

Which one of the following plots represents $f(x) = -\frac{|x|}{x}$, where $x$ is a non-zero real number?

Note: The figures shown are representative.
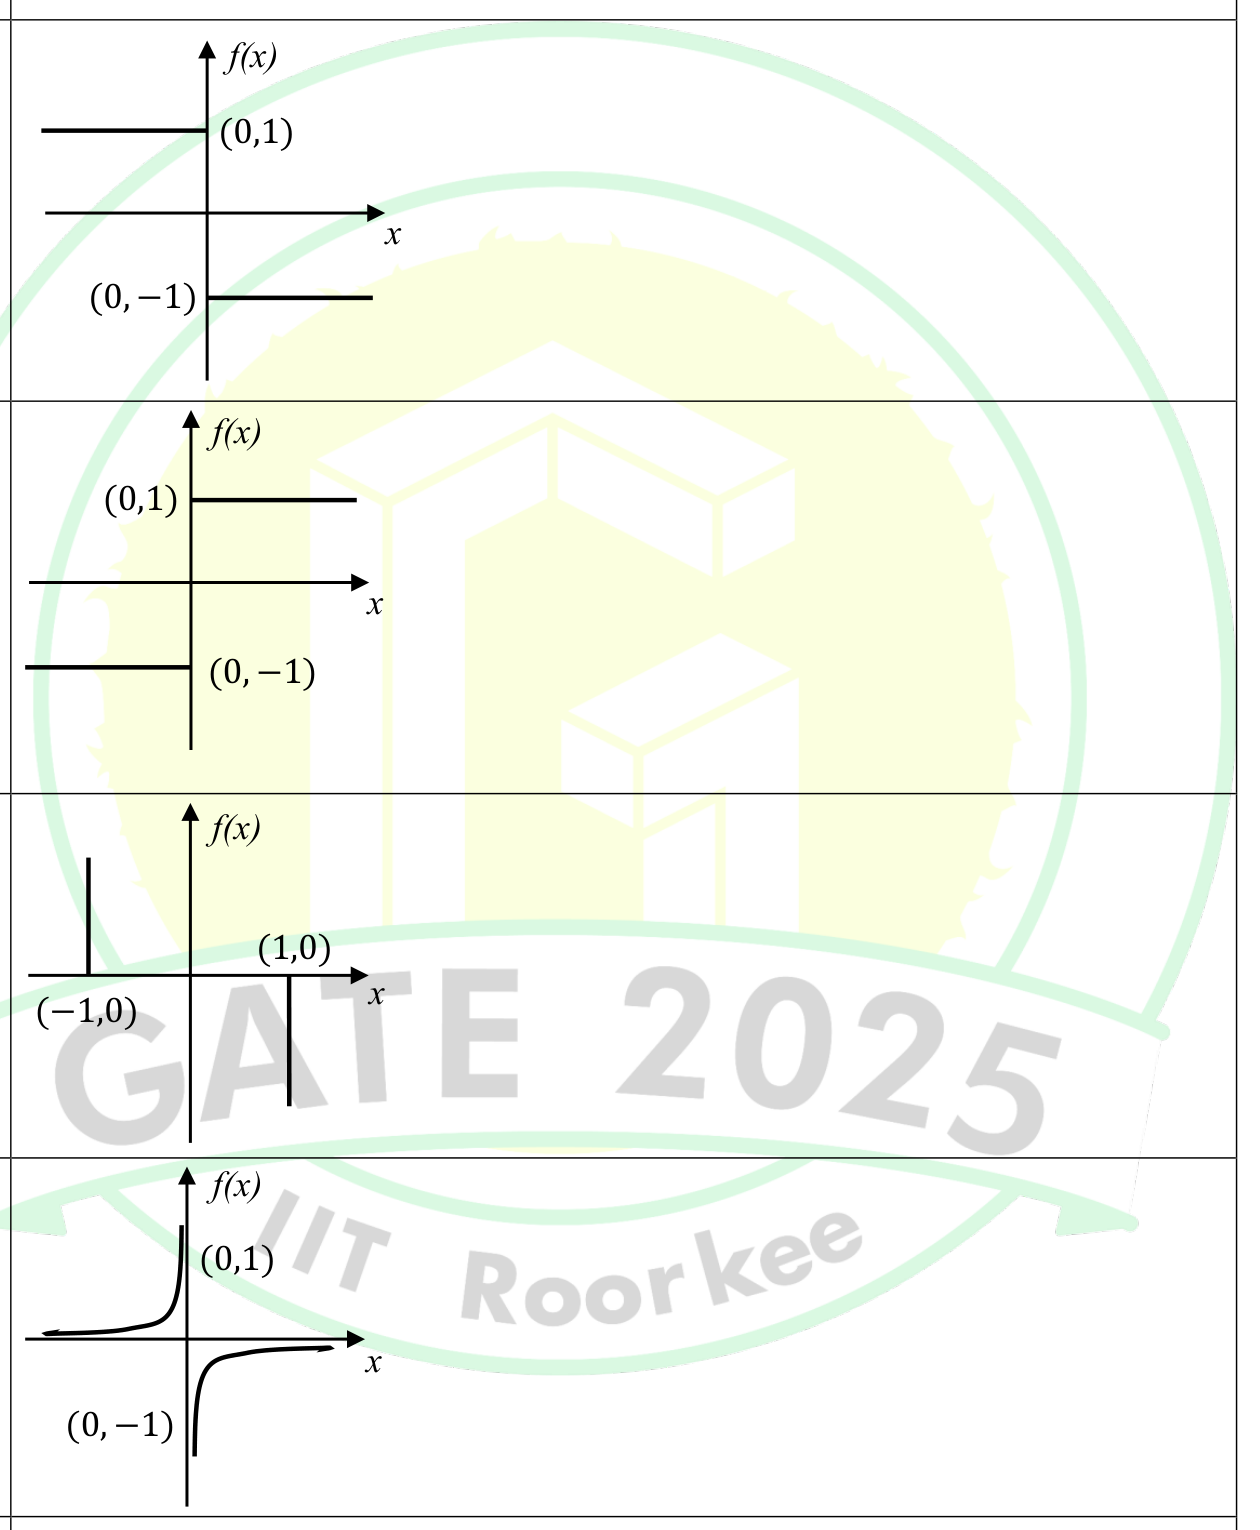
Four plots of $f(x)$ against $x$. (A) A horizontal line at height 1 to the left of the axis and a horizontal line at height $-1$ to the right. (B) A line at height 1 to the right and a line at height $-1$ to the left. (C) Two vertical lines at $x = -1$ and $x = 1$. (D) A curve rising towards 1 on the left and a curve falling away from $-1$ on the right.
  1. Option A in the figure
  2. Option B in the figure
  3. Option C in the figure
  4. Option D in the figure

Practise this question in The GATE Grind →

Show answer and explanation

Correct answer: (A) Option A in the figure

Explanation

For $x > 0$, $|x| = x$, so $f(x) = -1$. For $x < 0$, $|x| = -x$, so $f(x) = -\frac{-x}{x} = 1$. The graph is therefore the line $y = 1$ for negative $x$ and the line $y = -1$ for positive $x$, which is plot A.