GATE 2026 AE – Question 25
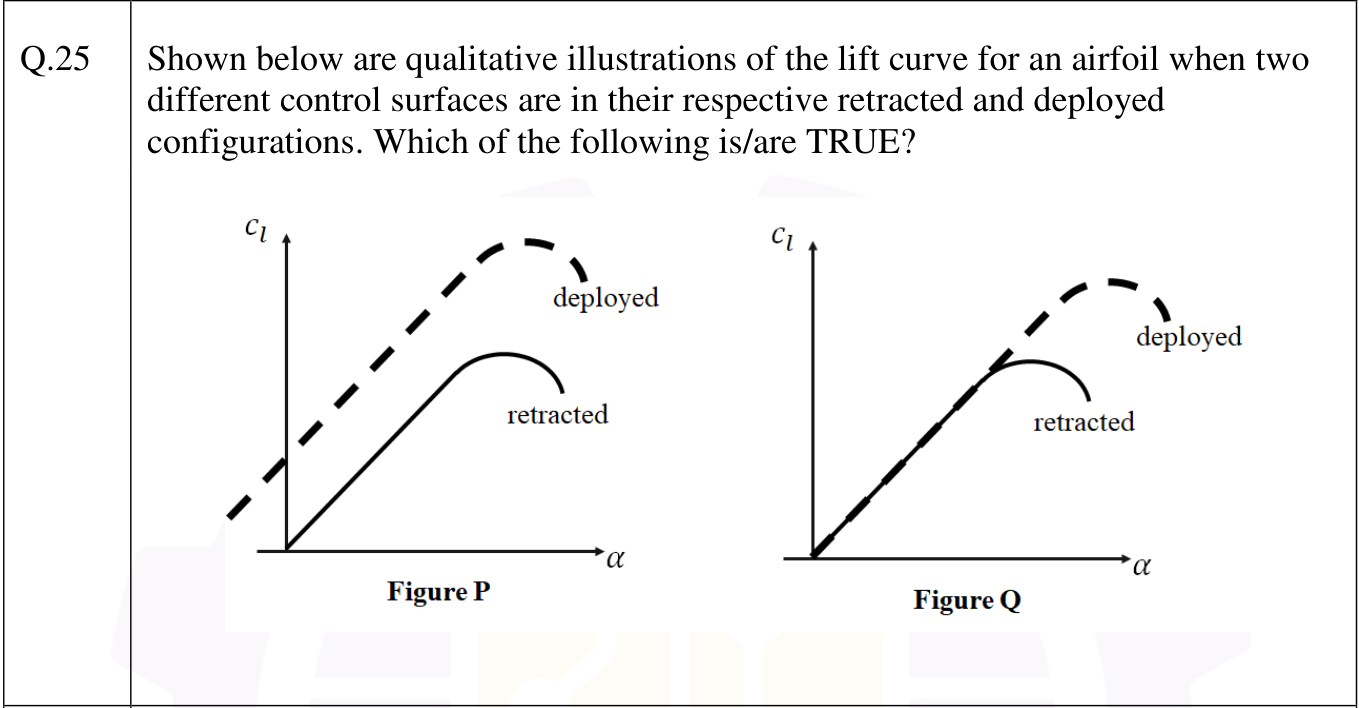
Shown below are qualitative illustrations of the lift curve for an airfoil when two different control surfaces are in their respective retracted and deployed configurations. Which of the following is/are TRUE?
Practise this question in The GATE Grind →
Show answer and explanation
Correct answer: (A) Figure P is for a flap; (C) Figure Q is for a slat
Explanation
A flap increases the camber, so the whole lift curve moves up (more lift at a given angle and a more negative zero-lift angle), as in Figure P. A slat does not change the lift at low angles. It delays stall, so the curve is extended to a higher angle and a higher maximum lift, as in Figure Q.