GATE 2023 CE (CE2) – Question 50
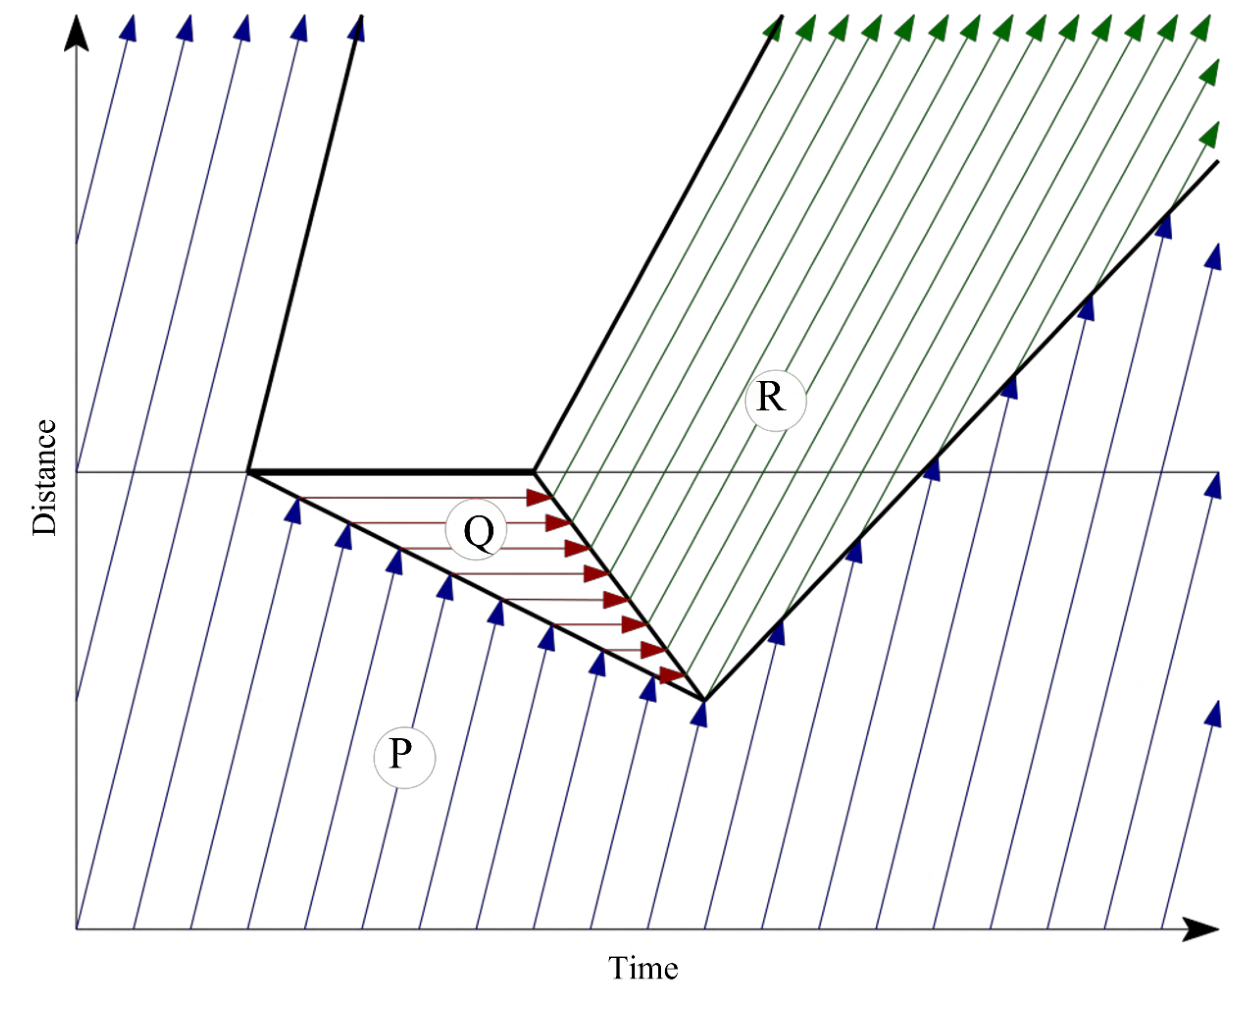
The figure presents the time-space diagram for when the traffic on a highway is suddenly stopped for a certain time and then released. Which of the following statements are true?
Practise this question in The GATE Grind →
Show answer and explanation
Correct answer: (B) Volume is lower in Region Q than in Region P; (C) Volume is higher in Region R than in Region P; (D) Density is higher in Region Q than in Region R
Explanation
On a time-space diagram, each vehicle is a line (trajectory). The **slope** of the line is its speed, and the closer the lines are together, the higher the density.
- **A. Speed in R is higher than in P.** The trajectories in R are shallower than in P, so the vehicles in R move more slowly. False.
- **B. Volume in Q is lower than in P.** In Q the traffic is stopped: the trajectories are horizontal and no vehicle passes a fixed point, so the volume is zero. True. ✓
- **C. Volume in R is higher than in P.** After the release the vehicles are more closely spaced than in P, so even at a lower speed the flow $q=k,v$ is larger. True. ✓
- **D. Density in Q is higher than in R.** The stopped queue is the most densely packed state. True. ✓
Correct: **B, C and D**.