GATE 2022 BT – Question 8
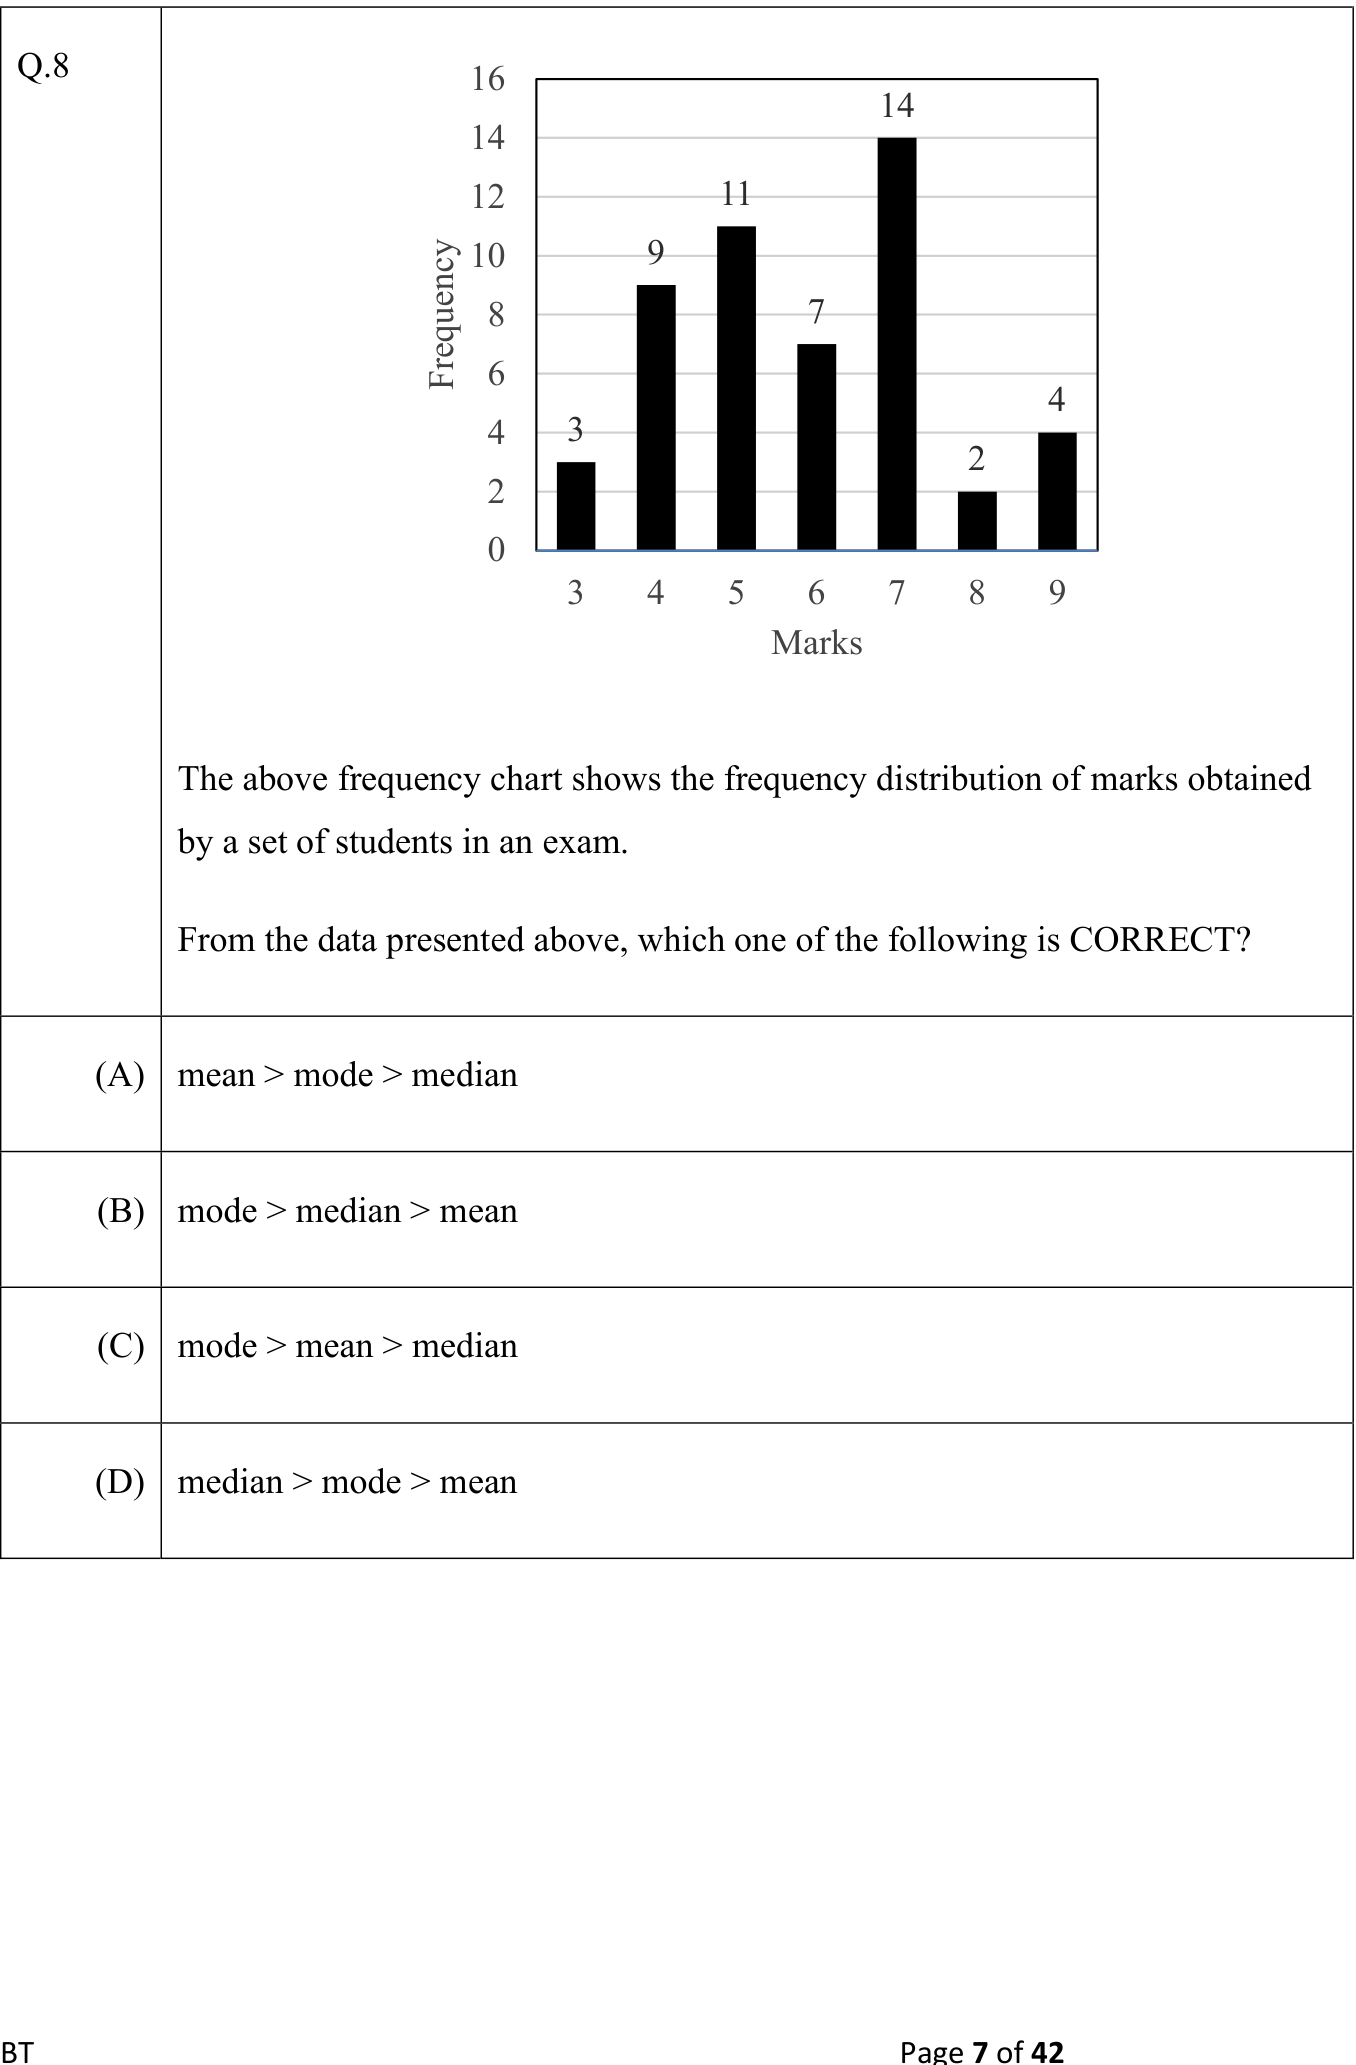
The above frequency chart shows the frequency distribution of marks obtained by a set of students in an exam. From the data presented above, which one of the following is CORRECT?
Practise this question in The GATE Grind →
Show answer and explanation
Correct answer: (B) mode > median > mean
Explanation
The frequencies sum to 50. The weighted total is 292, so the mean is 5.84; median is 6 and mode is 7. Therefore mean < median < mode.