GATE 2022 CE (CE1) – Question 44
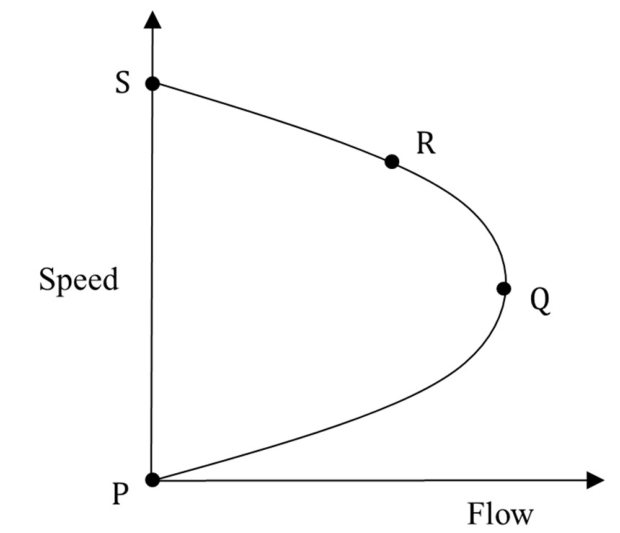
Consider the four points P, Q, R, and S shown in the Greenshields fundamental speed-flow diagram. Denote their corresponding traffic densities by kP, kQ, kR, and kS, respectively. The correct order of these densities is
Practise this question in The GATE Grind →
Show answer and explanation
Correct answer: (A) $k_P>k_Q>k_R>k_S$
Explanation
Greenshields gives $v=v_f(1-k/k_j)$, so density increases monotonically as speed decreases. In the plot the speeds decrease in the order S, R, Q, P.
Thus densities have the reverse order: $\mathbf{k_P>k_Q>k_R>k_S}$, **A**. At the zero-speed endpoint P, density is jam density even though flow is zero.