GATE 2020 CE (CE2) – Question 10
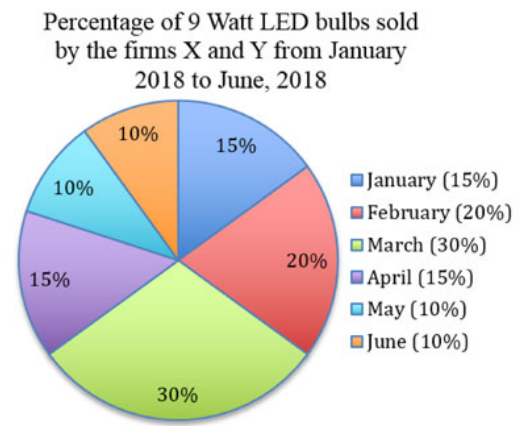
The pie chart and table show monthly sales of 9 W LED bulbs by X and Y from January to June 2018. If their combined April–June 2018 sales total 50000, find Y’s April–June sales. X:Y monthly ratios are January 7:8, February 2:3, March 2:1, April 3:2, May 1:4, June 9:11.
Practise this question in The GATE Grind →
Show answer and explanation
Correct answer: MTA
Explanation
April–June shares total 35% of six-month sales. Y’s corresponding shares are $15(2/5)=6\%$, $10(4/5)=8\%$ and $10(11/20)=5.5\%$, totaling 19.5%. Thus the printed April–June total gives $50000(19.5/35)=27857.14$, absent from the choices. A six-month total of 50000 would give 9750. The official key awards **marks to all**, preserved here.