GATE 2025 EC – Question 5
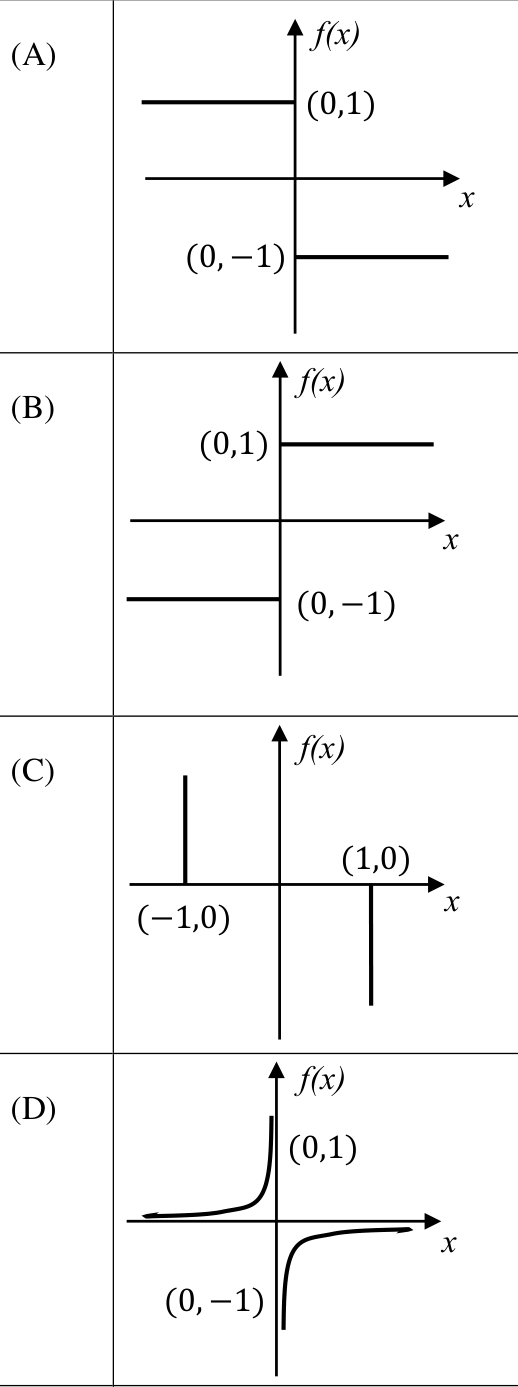
Which one of the following plots represents $f(x)=-\dfrac{|x|}{x}$, where $x$ is a non-zero real number?
Note: The figures shown are representative.
Practise this question in The GATE Grind →
Show answer and explanation
Correct answer: (A) Plot (A)
Explanation
For $x>0$, $|x|/x=1$ so $f(x)=-1$; for $x<0$, $|x|/x=-1$ so $f(x)=+1$. The graph is the line $y=+1$ for $x<0$ and $y=-1$ for $x>0$, which is plot (A).