GATE 2025 EC – Question 15
Consider an additive white Gaussian noise (AWGN) channel with bandwidth $W$ and noise power spectral density $\frac{N_0}{2}$. Let $P_{av}$ denote the average transmit power constraint.
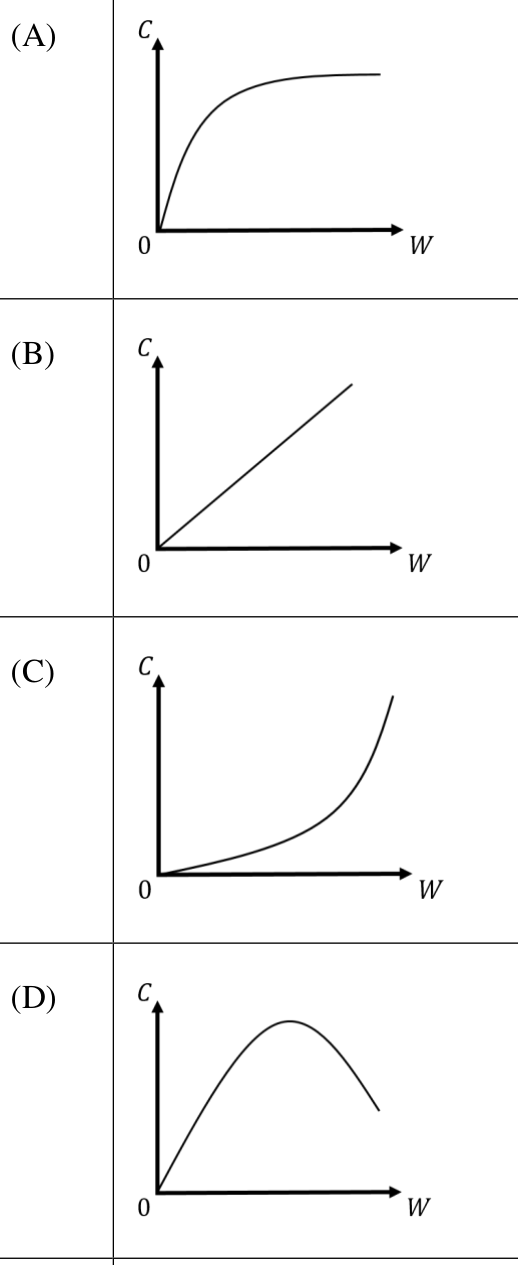
Which one of the following plots illustrates the dependence of the channel capacity $C$ on the bandwidth $W$ (keeping $P_{av}$ and $N_0$ fixed)?
Practise this question in The GATE Grind →
Show answer and explanation
Correct answer: (A) Plot (A)
Explanation
$C=W\log_2\!\left(1+\dfrac{P_{av}}{N_0W}\right)$. It increases with $W$ but with decreasing slope and saturates at $\frac{P_{av}}{N_0}\log_2e$ as $W\to\infty$. That is the concave, saturating curve in plot (A).