GATE 2020 CH – Question 10
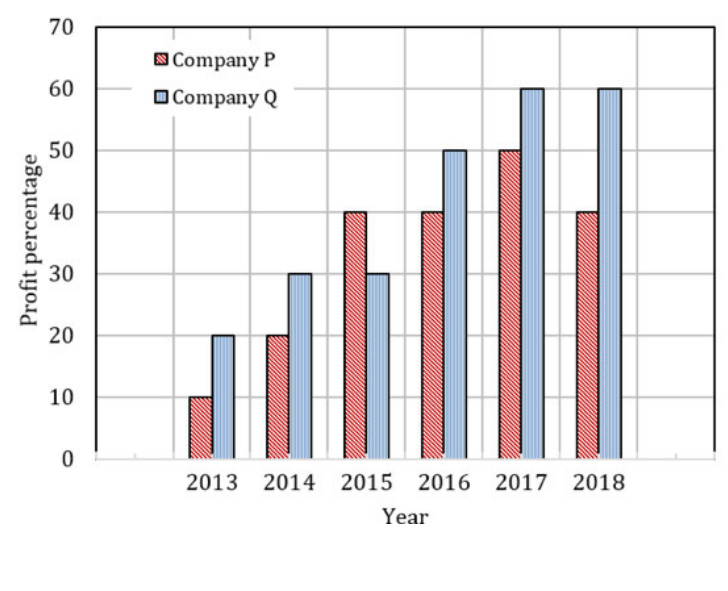
The chart shows profit percentages of companies P and Q during 2013–2018. Both invest a fixed, equal amount every year. Find the ratio of P’s total revenue to Q’s total revenue for these years.
Practise this question in The GATE Grind →
Show answer and explanation
Correct answer: (B) 16:17
Explanation
Let each annual investment be C. The six P percentages sum to $10+20+40+40+50+40=200$, so P’s total revenue is $6C+2C=8C$. Q’s percentages sum to $20+30+30+50+60+60=250$, giving $6C+2.5C=8.5C$. Their ratio is $8:8.5=16:17$, B. Using profit alone would omit the annual investments.
More Quantitative Aptitude: Data Interpretation, Arithmetic and Number Computation questions
- GATE 2026 CS (CS1) Q3
- GATE 2026 CS (CS1) Q4
- GATE 2026 CS (CS1) Q8
- GATE 2026 CS (CS1) Q10
- GATE 2026 CS (CS2) Q3
- GATE 2026 CS (CS2) Q4
All Quantitative Aptitude: Data Interpretation, Arithmetic and Number Computation questions →