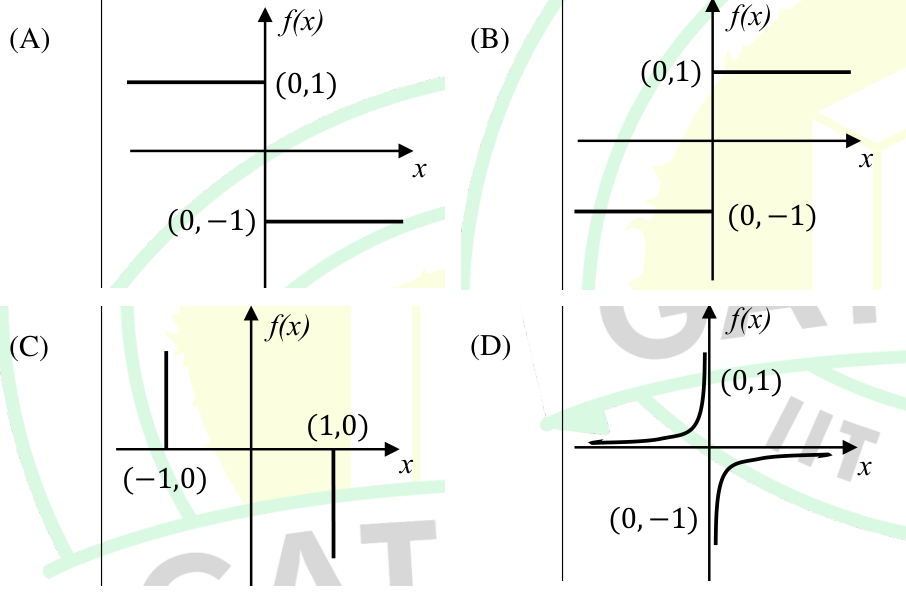
For $x > 0$, $|x| = x$, so $f(x) = -1$. For $x < 0$, $|x| = -x$, so $f(x) = -\frac{-x}{x} = 1$. The graph is therefore the line $y = 1$ for negative $x$ and the line $y = -1$ for positive $x$, which is plot A.
More Quantitative Aptitude: Algebra, Geometry and Mensuration questions
GATE 2025 BM Q7– A stick of length one meter is broken at two locations at distances of b 1 and b 2 from…
GATE 2024 BM Q2– In a locality, the houses are numbered in the following way: The house-numbers on one side…
GATE 2024 BM Q3– For positive integers p and q, with pq 1, (pq)p/q = p(pq - 1). Then,
GATE 2024 BM Q7– Three distinct sets of indistinguishable twins are to be seated at a circular table that…
GATE 2024 BM Q10– During a half-moon phase, the Earth-Moon-Sun form a right triangle. If the Moon-Earth-Sun…