GATE 2016 EC (EC2) – Question 57
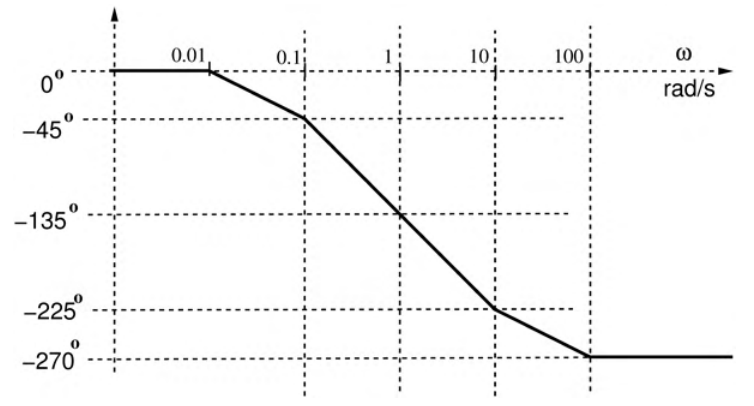
The figure is the asymptotic Bode phase plot of $G(s)=k/[(s+0.1)(s+10)(s+p_1)]$, with k and $p_1$ positive. The value of $p_1$ is ________.
Practise this question in The GATE Grind →
Show answer and explanation
Correct answer: 0.95 to 1.05
Explanation
Each real pole contributes a −45°/decade phase ramp from one decade below its break frequency to one decade above.
The known poles 0.1 and 10 begin their ramps at 0.01 and 1 rad/s. The graph changes from −45°/decade to −90°/decade at 0.1 rad/s, showing the additional pole's ramp begins there. Its break frequency is ten times that value.
Hence **$p_1=1$ rad/s**, also consistent with −135° at 1 rad/s.