GATE 2020 EC – Question 10
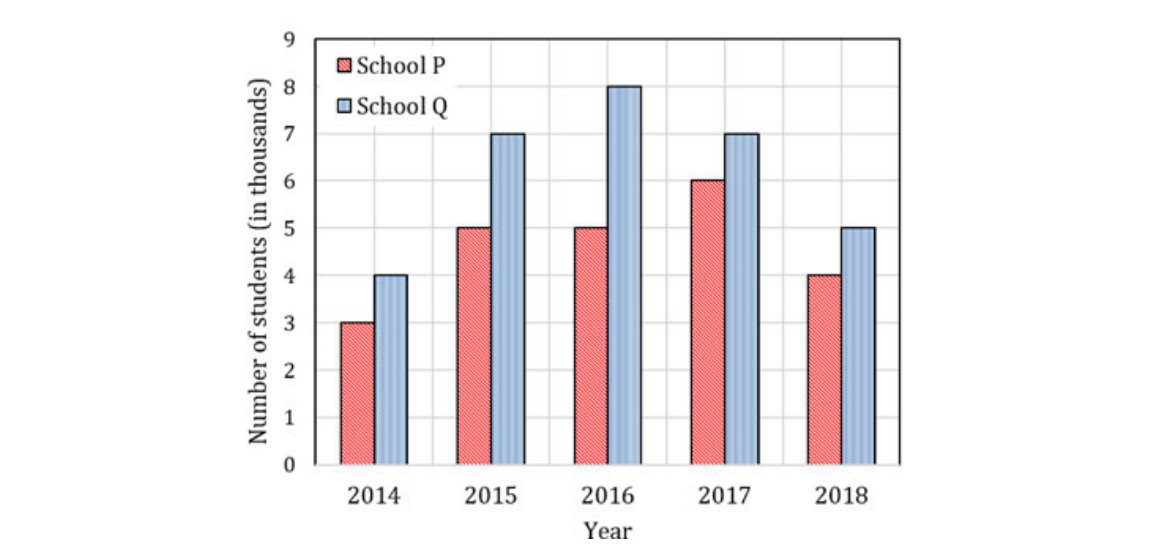
The following figure shows the data of students enrolled in 5 years (2014 to 2018) for two schools P and Q. During this period, the ratio of the average number of the students enrolled in school P to the average of the difference of the number of students enrolled in schools P and Q is ________.
Practise this question in The GATE Grind →
Show answer and explanation
Correct answer: (B) 23 : 8
Explanation
School P had $3,5,5,6,4$ thousand students (total 23) and school Q had $4,7,8,7,5$. The differences are $1,2,3,1,1$, a total of 8. Both averages are over 5 years, so the ratio of the averages is $23:8$.