GATE 2020 EC – Question 24
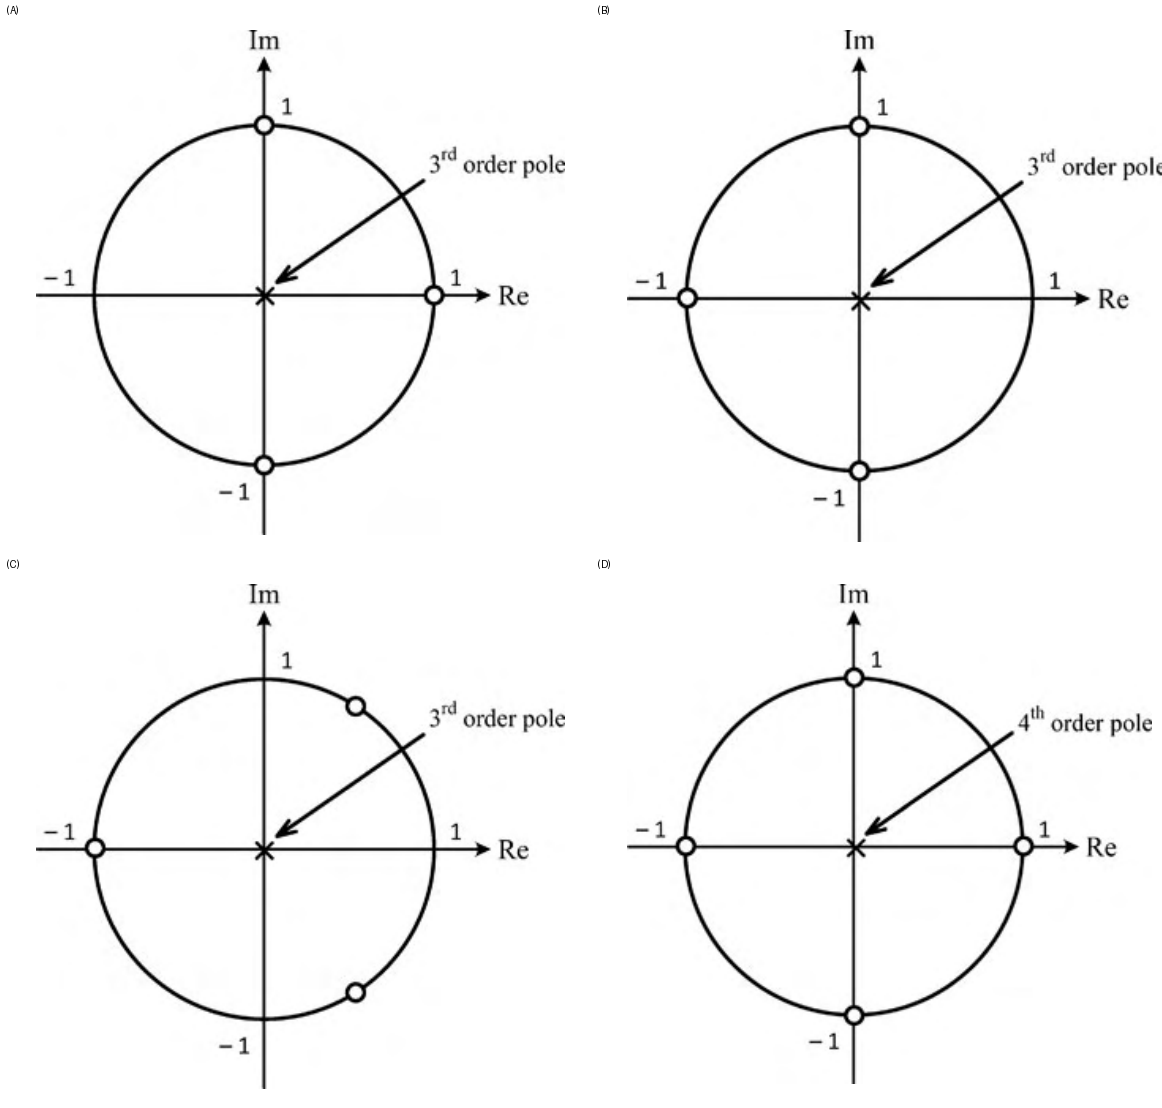
Which one of the following pole-zero plots corresponds to the transfer function of an LTI system characterized by the input-output difference equation given below?
$$y[n]=\sum_{k=0}^{3}(-1)^kx[n-k]$$
Practise this question in The GATE Grind →
Show answer and explanation
Correct answer: (A) Pole-zero plot (A)
Explanation
$H(z)=1-z^{-1}+z^{-2}-z^{-3}=\frac{z^3-z^2+z-1}{z^3}=\frac{(z-1)(z^2+1)}{z^3}$. The zeros are at $z=1$ and $z=\pm j$, and there is a third-order pole at the origin. Plot (A) shows exactly these.