GATE 2021 XH5 – Question 65
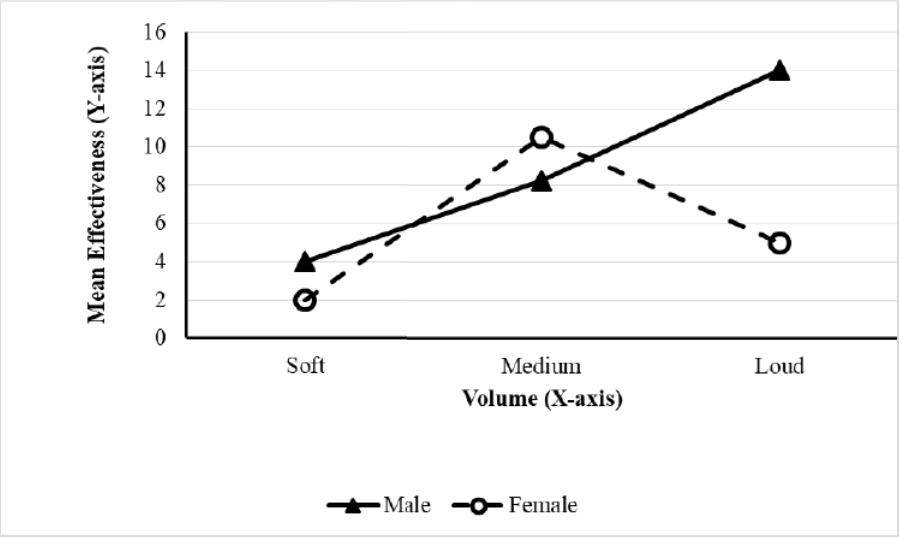
A study plots mean advertisement effectiveness against soft, medium and loud volume. The solid line represents males and the dashed line females. Which interpretations fit the graph?
Practise this question in The GATE Grind →
Show answer and explanation
Correct answer: (A) A linear relationship is shown for males and a nonlinear one for females.; (B) The effect of increasing volume depends on whether the participant is male or female.
Explanation
The solid series rises across volume levels; the dashed series rises and then falls, so A describes the displayed trends. The different response profiles show that volume’s effect depends on the group, an interaction supporting B. C denies that interaction and D ignores the female curve. Thus select A,B. Here “linear” follows the source’s graphical trend description rather than asserting that the approximate plotted male points establish an exact fitted line.