GATE 2024 MN – Question 8
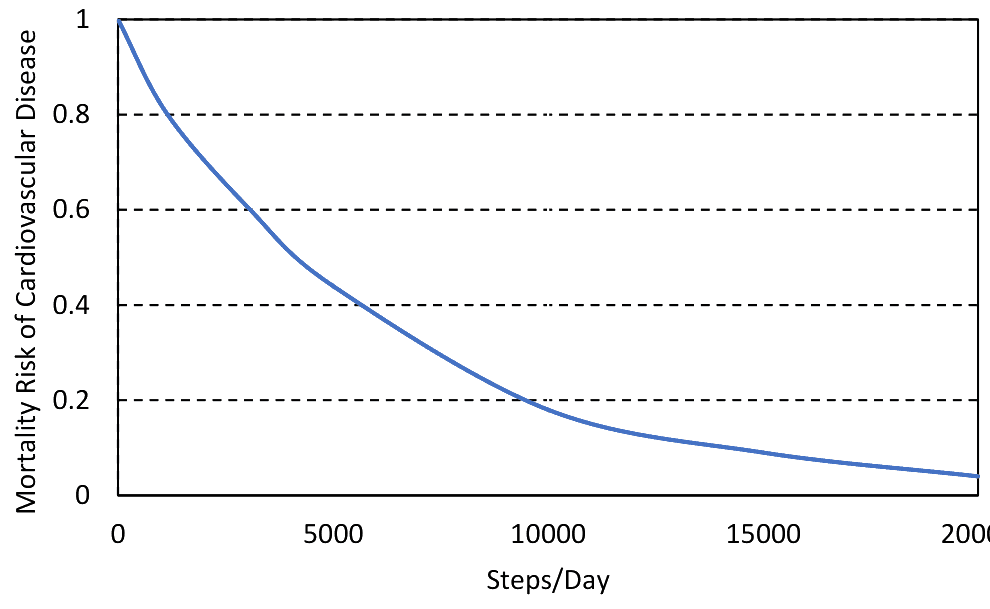
The plot below shows the relationship between the mortality risk of cardiovascular disease and the number of steps a person walks per day. Based on the data, which one of the following options is true?
Practise this question in The GATE Grind →
Show answer and explanation
Correct answer: (C) For any 5000 increment in steps/day the largest risk reduction occurs on going from 0 to 5000.
Explanation
Compare vertical decreases over equal horizontal intervals on the plotted curve. It falls rapidly near zero steps and then becomes progressively flatter, so the first 5000-step interval has the greatest fall in the displayed risk.
That is **C**. A and B reverse the early-versus-late comparison, and D assigns the largest fall to the flattest final interval. Exact unlabelled intermediate risk values are unnecessary; the curve's shape determines the comparison. This is interpretation of the supplied graph, without an additional claim that it proves causation.
More Analytical Aptitude: Logical Reasoning, Deduction and Analogy questions
- GATE 2023 MN Q4
- GATE 2023 MN Q6
- GATE 2022 MN Q9
- GATE 2026 AR — Architecture Q5
- GATE 2026 AR — Architecture Q8
- GATE 2026 AR — Planning Q5
All Analytical Aptitude: Logical Reasoning, Deduction and Analogy questions →