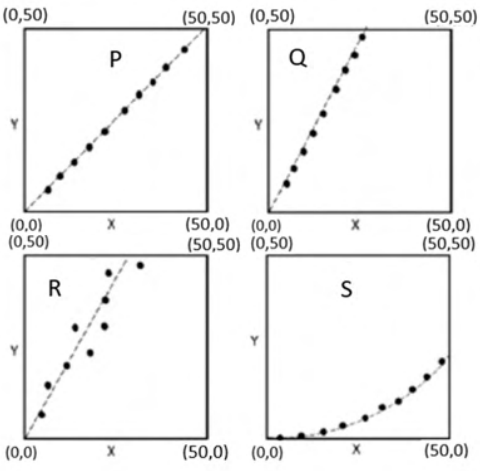
Match plots P–S to attributes I: $\sigma_x>\sigma_y$, $0<\rho<1$; II: $\sigma_y>\sigma_x$, $\rho=1$; III: $\sigma_y>\sigma_x$, $0<\rho<1$; IV: $\sigma_x=\sigma_y$, $\rho=1$. Here σ denotes standard deviation and ρ the Pearson correlation.
P lies exactly on the equal-scale 45° line, giving equal spreads and perfect correlation (IV). Q lies on a steeper straight line, so Y has larger spread and correlation one (II). R is a scattered steep positive trend, giving larger Y spread and correlation below one (III). S is a curved positive trend with larger X spread and non-perfect Pearson correlation (I). Thus D.
More Probability and Statistics questions
GATE 2022 MN Q44– Daily probability of full COVID-bed occupancy at a health centre is 0.8. Under the…
GATE 2021 MN Q16– Which set consists only of measures of dispersion?
GATE 2021 MN Q23– The standard normal distribution is described in the source as which type?
GATE 2021 MN Q24– For independent random variables X, Y, what is Var(X+Y)?
GATE 2021 MN Q46– Test H₀:mean Fe=62% against Hₐ:mean Fe<62%. A sample of five grades is 58%, 56%, 60%, 64%,…
GATE 2021 MN Q59– X takes−2, 3, 1 with probabilities 1/3, 1/2, 1/6 respectively. Find E(X²), to one decimal.