GATE 2022 AR — Planning – Question 51
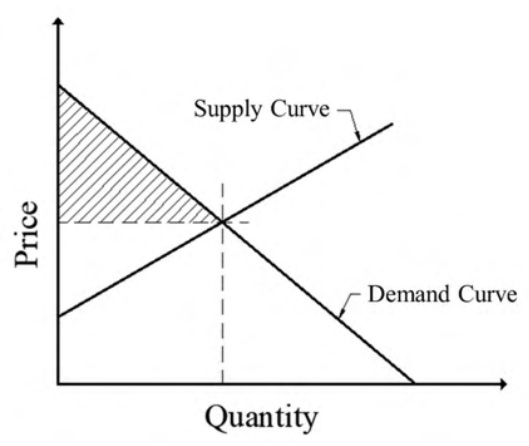
What is the shaded area in the demand-supply graph called?
Practise this question in The GATE Grind →
Show answer and explanation
Correct answer: (A) Consumer surplus
Explanation
The shaded region lies below the demand curve and above the market price, up to the equilibrium quantity. It represents willingness to pay minus actual payment: consumer surplus, A. Producer surplus would be the region above supply and below price.
More Economics concepts of land, rent, land use and land values questions
All Economics concepts of land, rent, land use and land values questions →