GATE 2026 XE — all source sections – Question 123
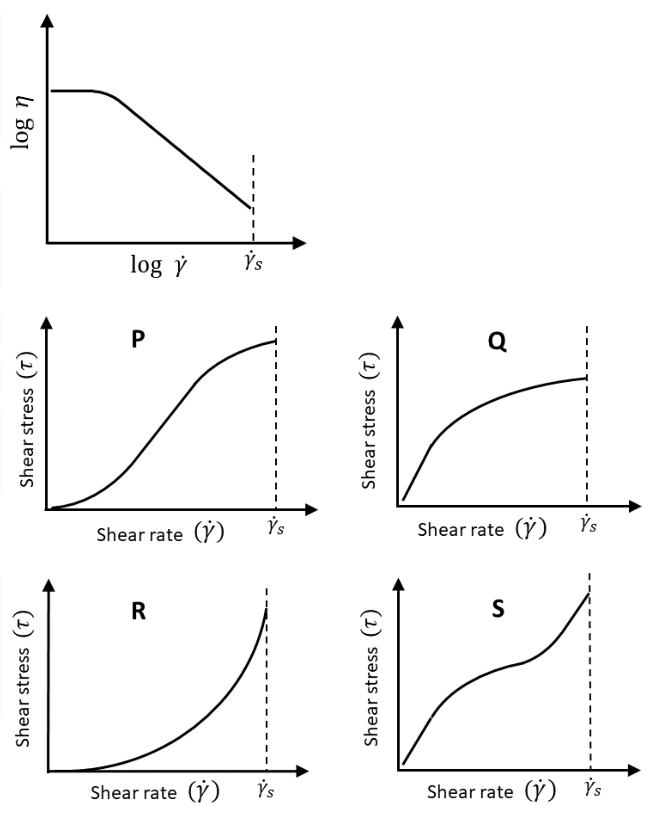
The upper plot shows steady shear viscosity η versus shear rate on logarithmic axes, with γ̇s the upper applied shear rate. Which lower curve P, Q, R, S best represents shear stress versus shear rate for the same melt?
Practise this question in The GATE Grind →
Show answer and explanation
Correct answer: (B) Q
Explanation
Shear stress is τ=ηγ̇. At low rates the viscosity plateau gives approximately linear stress growth. In the shear-thinning region, viscosity decreases with rate, so stress continues increasing with reduced slope in the usual stable polymer-melt regime. Curve Q has the required near-origin linear trend followed by concave-down growth: B. A decreasing viscosity does not require a decreasing stress.