GATE 2024 XE — all source sections – Question 60
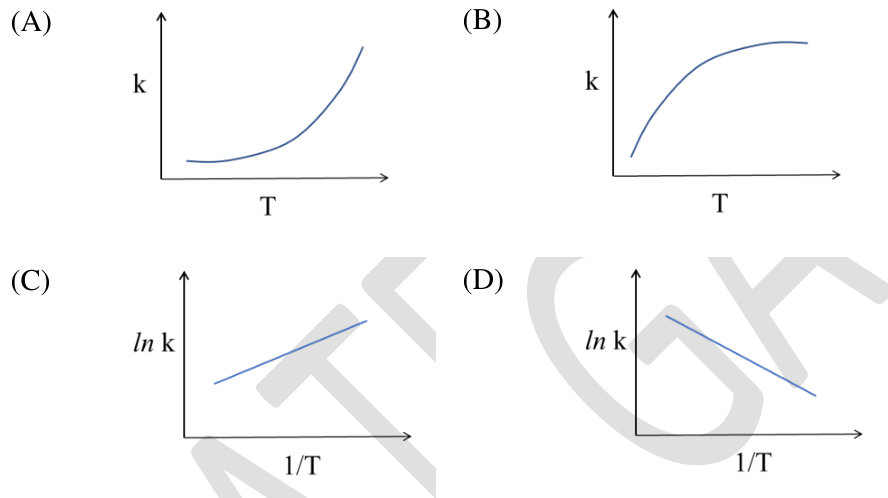
For first-order rate constant k and absolute temperature T, which depicted temperature-dependence plots are correct?
Practise this question in The GATE Grind →
Show answer and explanation
Correct answer: (A) Graph A; (D) Graph D
Explanation
For the standard positive-activation-energy Arrhenius model, k = Aexp ( − Ea/RT). In the usual plotted temperature range, k increases rapidly with T, A. Taking logarithms gives ln k = ln A − Ea/(RT), a straight line of negative slope against1/T, D. The official selections are A, D.
More Thermodynamics, Kinetics and Phase Transformations questions
- GATE 2023 XE — all source sections Q44
- GATE 2023 XE — all source sections Q47
- GATE 2023 XE — all source sections Q56
- GATE 2023 XE — all source sections Q63
- GATE 2019 XE — all source sections Q48
- GATE 2019 XE — all source sections Q55
All Thermodynamics, Kinetics and Phase Transformations questions →