GATE 2019 CS – Question 7
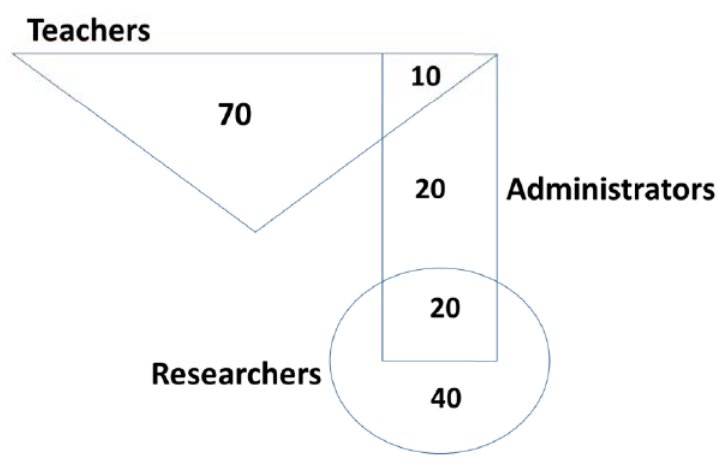
In the given diagram, teachers are represented in the triangle, researchers in the circle and administrators in the rectangle. Out of the total number of the people, the percentage of administrators shall be in the range of ________.
Practise this question in The GATE Grind →
Show answer and explanation
Correct answer: (C) 31 to 45
Explanation
Count people by disjoint labeled regions, so nobody in an overlap is counted twice. The total is $70+10+20+20+40=160$.
Administrators are everyone inside the rectangle: 10 in its overlap with the teachers, 20 in the rectangle alone, and 20 in its overlap with the researchers. Their count is therefore 50.
The requested percentage is
$$100\frac{50}{160}=31.25\%.$$
This lies in **31 to 45%, C**. Using only the rectangle's non-overlap region would omit administrators who also teach or research.
More Quantitative Aptitude: Data Interpretation, Arithmetic and Number Computation questions
- GATE 2018 CS Q4
- GATE 2018 CS Q5
- GATE 2018 CS Q6
- GATE 2018 CS Q8
- GATE 2015 CS (CS1) Q8
- GATE 2015 CS (CS1) Q10
All Quantitative Aptitude: Data Interpretation, Arithmetic and Number Computation questions →