GATE 2025 XH-C6 (Sociology) – Question 5
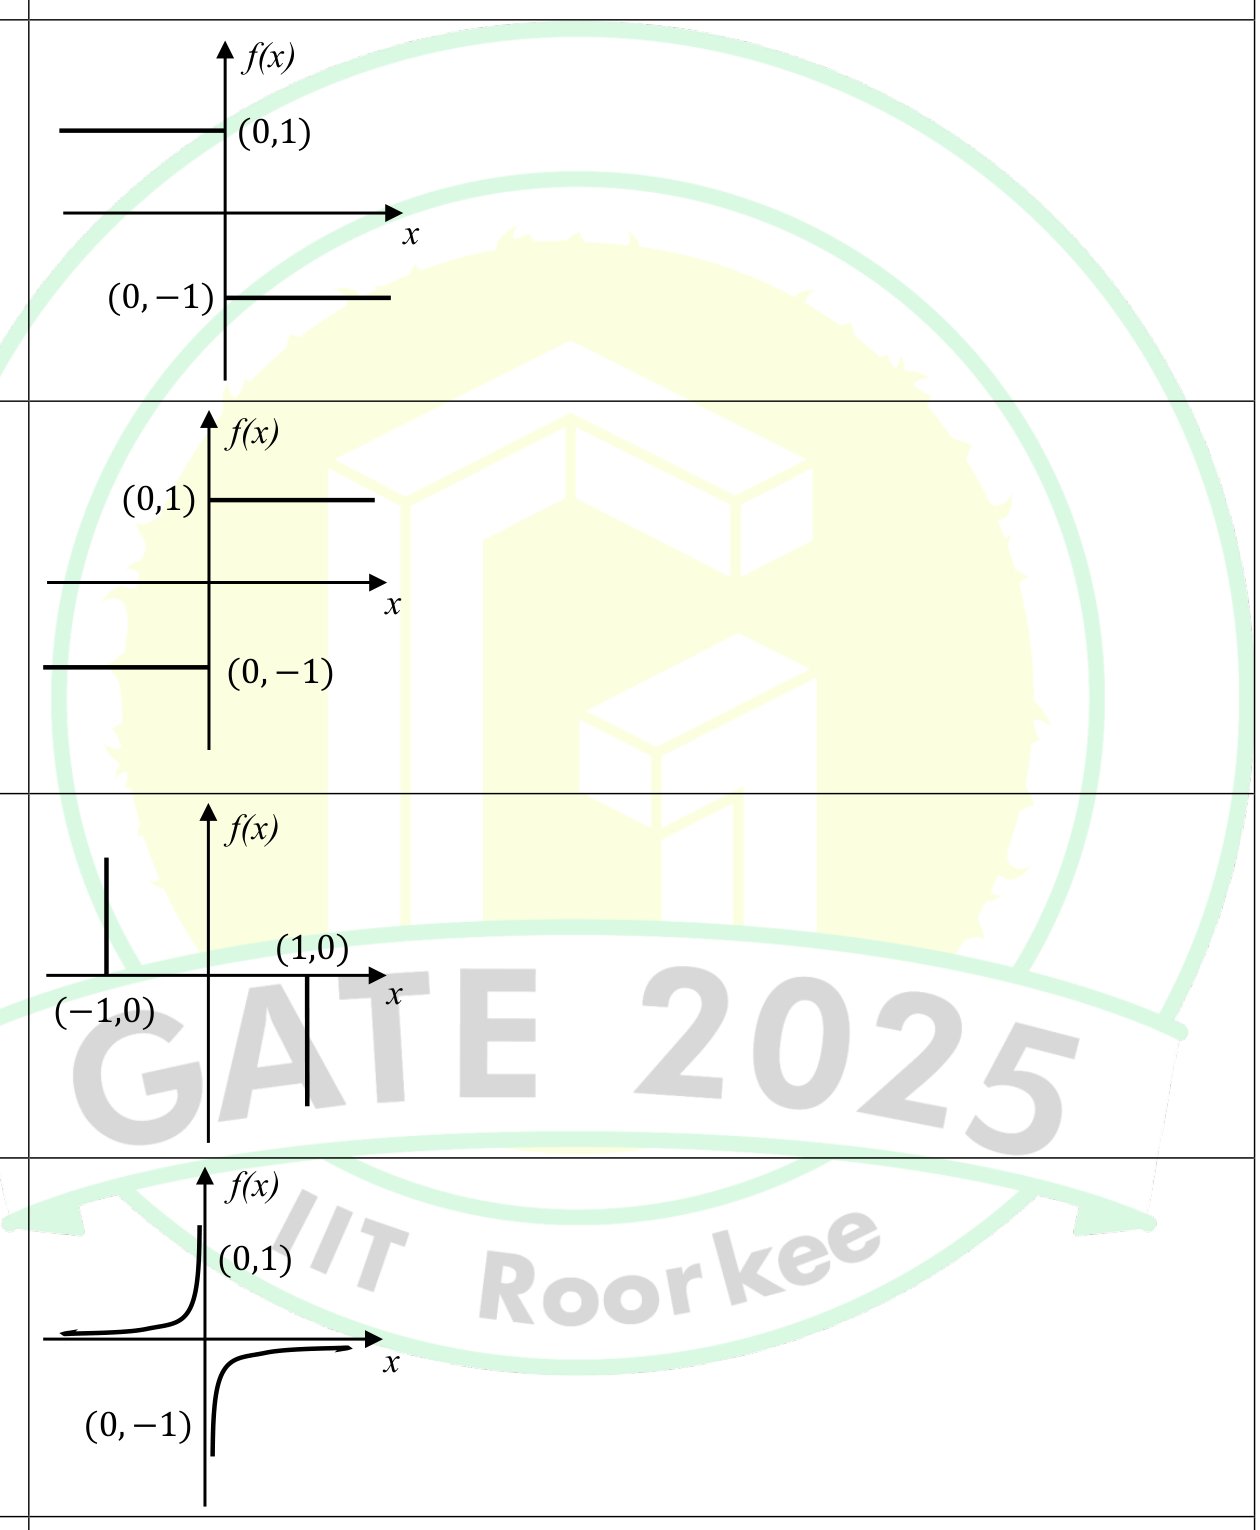
Which one of the following plots represents $f(x) = -\frac{|x|}{x}$, where $x$ is a non-zero real number?
Note: The figures shown are representative.
Practise this question in The GATE Grind →
Show answer and explanation
Correct answer: (A) Option A in the figure
Explanation
For nonzero $x$, $|x|/x$ is 1 for positive $x$ and −1 for negative $x$. The leading minus reverses these two horizontal levels.
More Quantitative Aptitude: Algebra, Geometry and Mensuration questions
- GATE 2025 XH-C6 (Sociology) Q7
- GATE 2026 XH-C6 (Sociology) Q10
- GATE 2025 CS (CS1) Q7
- GATE 2025 CS (CS2) Q3
- GATE 2025 CS (CS2) Q9
- GATE 2024 CS (CS1) Q2
All Quantitative Aptitude: Algebra, Geometry and Mensuration questions →