GATE 2016 EC – Question 15
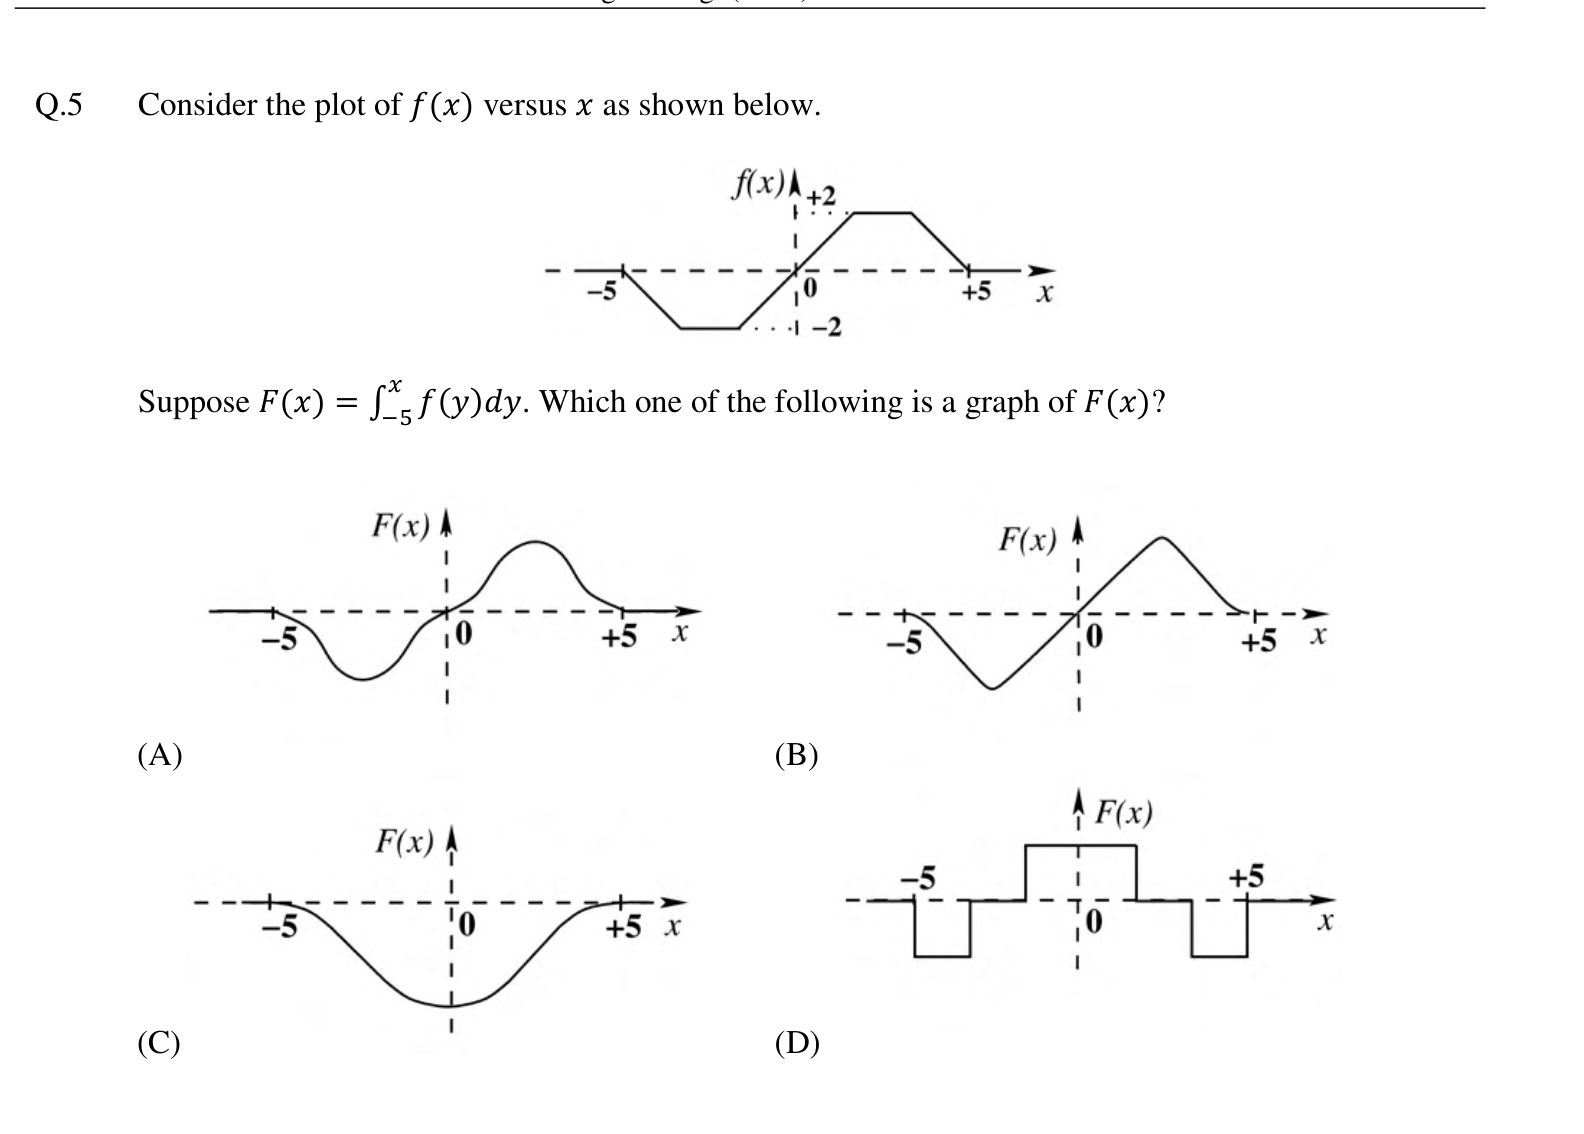
Consider the plot of $f(x)$ versus $x$ as shown below.
[Figure: $f(x)$ is zero at $x = -5$, then falls to $-2$ and stays flat for a while, rises through 0 at $x = 0$, reaches $+2$ and stays flat, and then falls back to 0 at $x = +5$. It is symmetric about the origin (an odd function).]
Suppose $F(x) = \int_{-5}^{x} f(y) \, dy$. Which one of the following is a graph of $F(x)$?
Practise this question in The GATE Grind →
Show answer and explanation
Correct answer: (C) The graph labelled (C) in the figure
Explanation
$F(x)$ is the running area under $f$. While $f$ is negative, from $-5$ to 0, $F$ goes down, and it reaches its minimum at $x = 0$ where $f$ changes sign. While $f$ is positive, $F$ rises. Since $f$ is odd, the positive area equals the negative area, so $F$ returns to 0 at $x = 5$. Because $f$ is continuous, $F$ is smooth. The graph that is a smooth dip below zero with its minimum at $x = 0$, returning to zero at $x = 5$, is graph (C).