GATE 2024 ME – Question 8
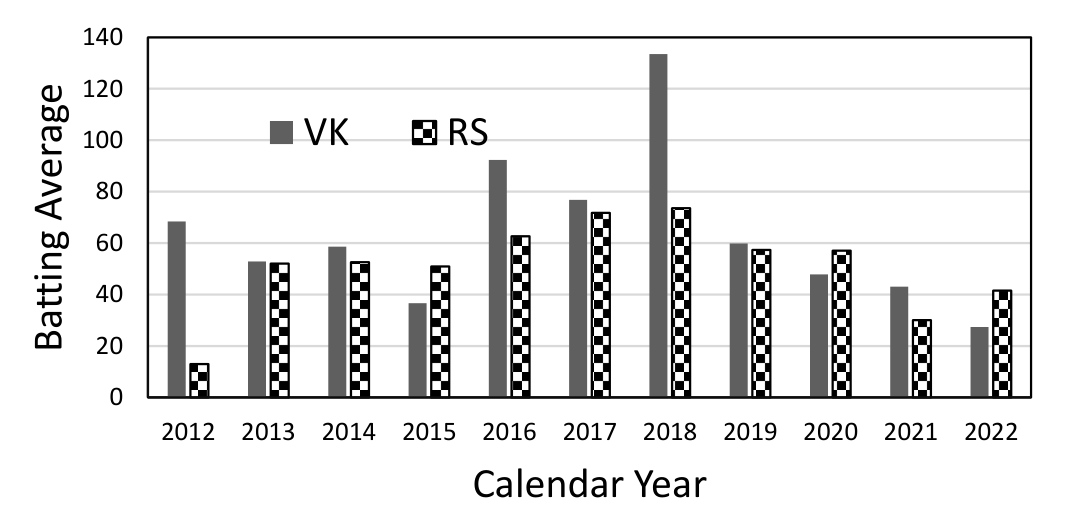
The bar chart gives the batting averages of VK and RS for 11 calendar years from 2012 to 2022. Considering that 2015 and 2019 are world cup years, which one of the following options is true?
Practise this question in The GATE Grind →
Show answer and explanation
Correct answer: (C) VK's yearly batting average is consistently higher than that of RS between the two world cup years.
Explanation
The world cup years are 2015 and 2019. In 2015 RS (about 51) is above VK (about 37), but in 2019 VK (about 60) is above RS (about 58), so neither A nor B is true for every world cup year. Between the two, in 2016, 2017 and 2018, VK is above RS each time (about 92 against 63, 77 against 72 and 133 against 74), so C is true. In the last three years RS is higher in 2020 and 2022 but not in 2021 (VK about 43, RS about 30), so D is false.