GATE 2023 PH – Question 50
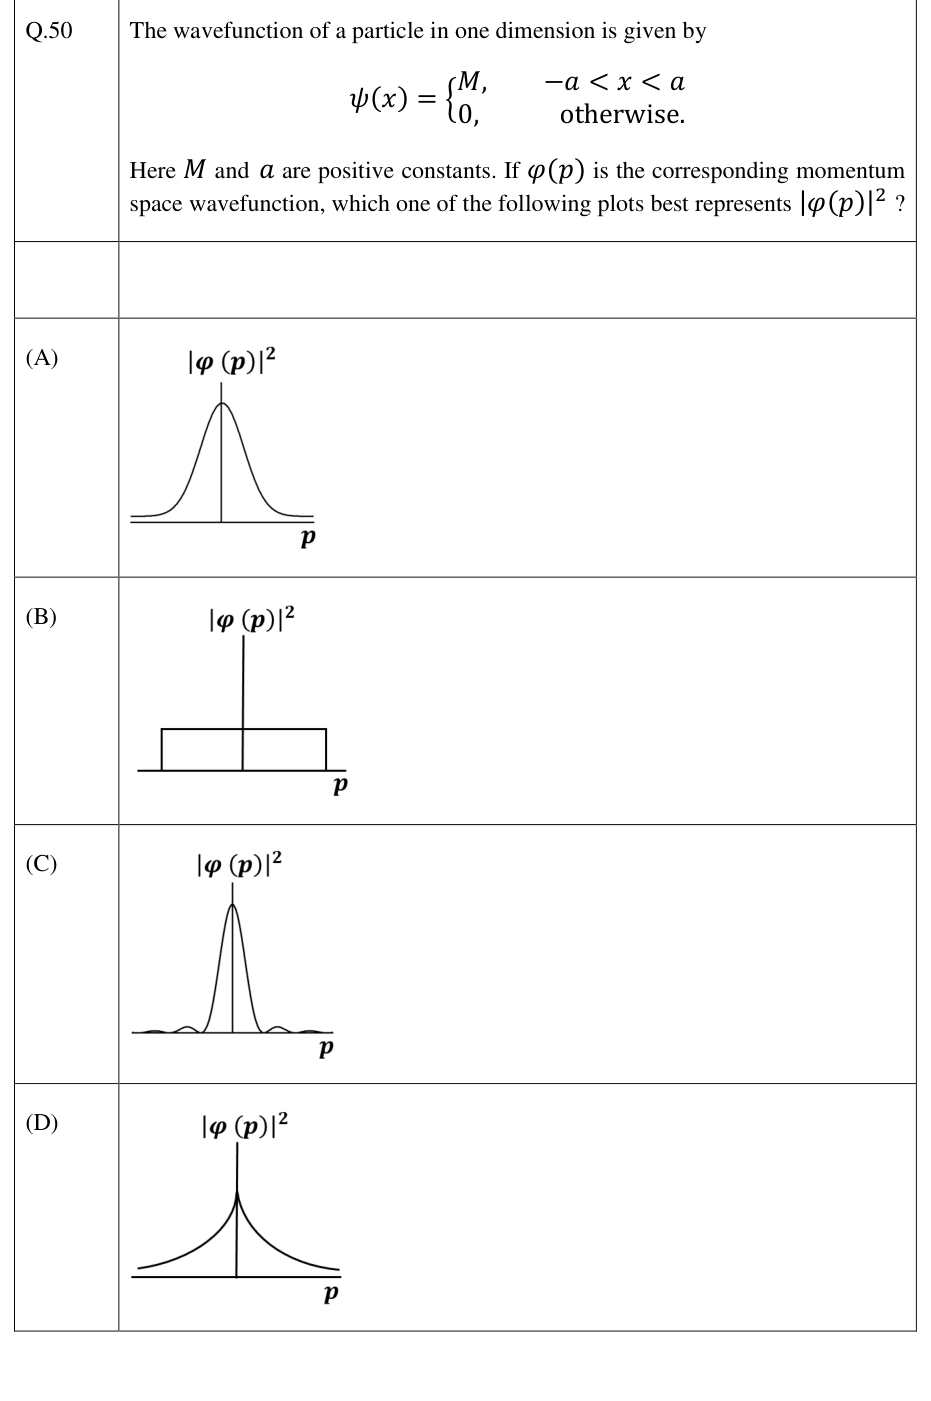
$\psi(x)=M$ for $-a<x<a$ and zero otherwise. Which plot represents the momentum probability density $|\varphi(p)|^2$?
Practise this question in The GATE Grind →
Show answer and explanation
Correct answer: (C) Option C in the figure
Explanation
The Fourier amplitude is proportional to $\sin(pa/\hbar)/p$, whose square has a central peak with zeros and side lobes.