GATE 2020 CE (CE1) – Question 42
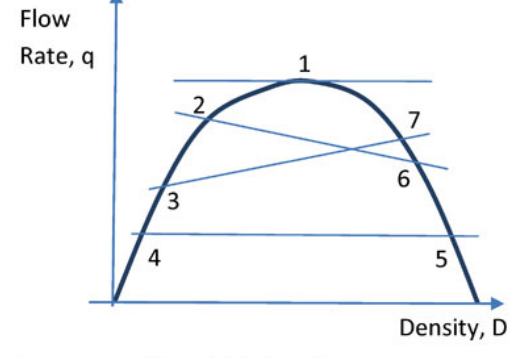
Traffic flow q and density D are related as shown. Which depicts the shock-wave condition?
Practise this question in The GATE Grind →
Show answer and explanation
Correct answer: MTA
Explanation
Wave speed between states is $(q_2-q_1)/(D_2-D_1)$. Transition 2→6 moves to denser, lower-flow traffic and produces an upstream-moving congestion wave, illustrated by B. But the wording does not uniquely restrict the possible wave states. The official item is **MTA**, which is preserved.