GATE 2026 IN – Question 41
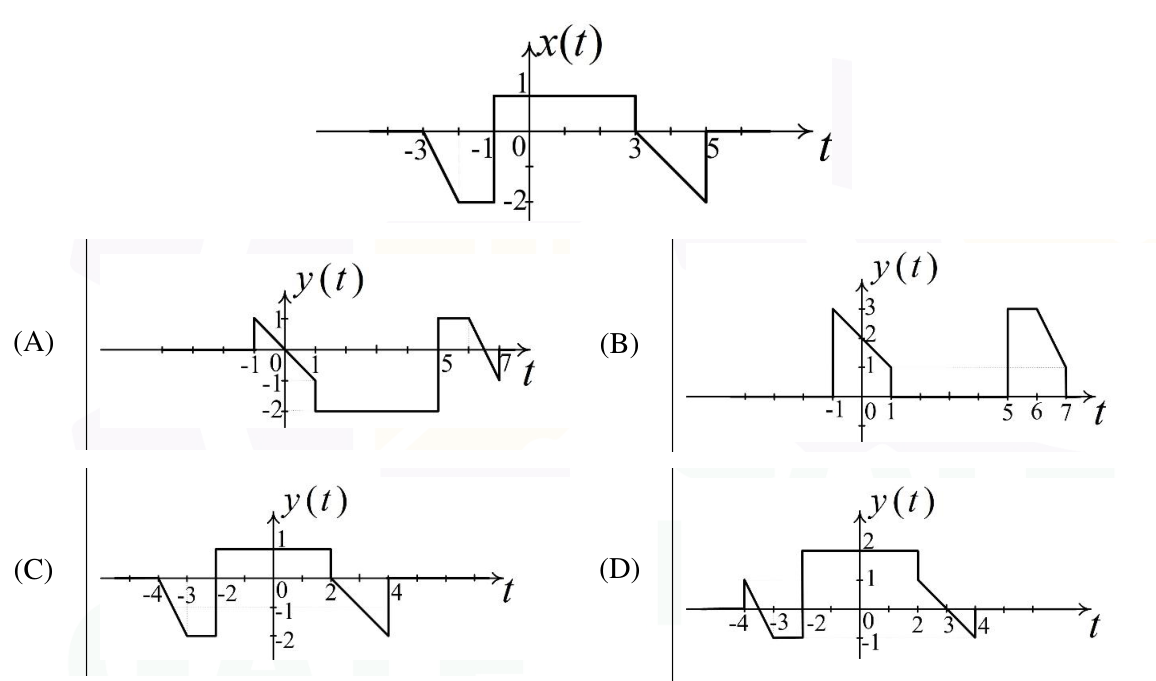
A signal $x(t)$ is shown in the first graph. The plot of $y(t)=1-x(4-t)$ is shown in ________. The candidate plots are labeled A–D in the figure.
Practise this question in The GATE Grind →
Show answer and explanation
Correct answer: (B) Graph B
Explanation
The substitution $x(4-t)$ maps an original time $\tau$ to $t=4-\tau$, reversing the time axis. The breakpoints $-3,-2,-1,3,5$ therefore map to $7,6,5,1,-1$.
Next subtract the original amplitude from 1. The original ramp on $3\le\tau\le5$ becomes a descending segment from 3 to 1 on $-1\le t\le1$. The original plateau at $-2$ becomes a plateau at 3 on $5\le t\le6$, followed by a descent to 1 at $t=7$.
These segments identify **B**, the official choice. Wherever the original signal is zero, the transformed signal must be 1. The candidate drawings do not clearly extend that baseline outside their depicted segments; this source limitation is retained.