GATE 2018 ME (ME1) – Question 9
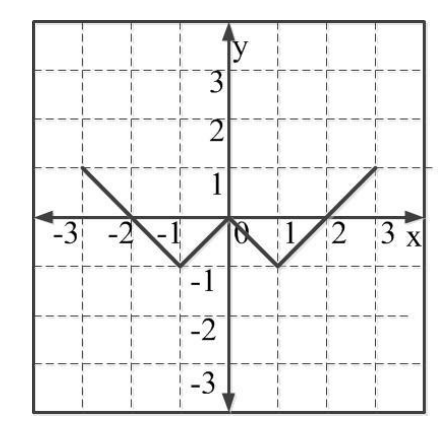
Which function describes the plotted graph?
Practise this question in The GATE Grind →
Show answer and explanation
Correct answer: (B) $y=\bigl||x|-1\bigr|-1$
Explanation
The graph is symmetric about the y-axis, with zeros at x = 0, ±2 and minima −1 at x = ±1. The function $y=\bigl||x|-1\bigr|-1$ has precisely these features (B).