GATE 2018 CE (CE2) – Question 25
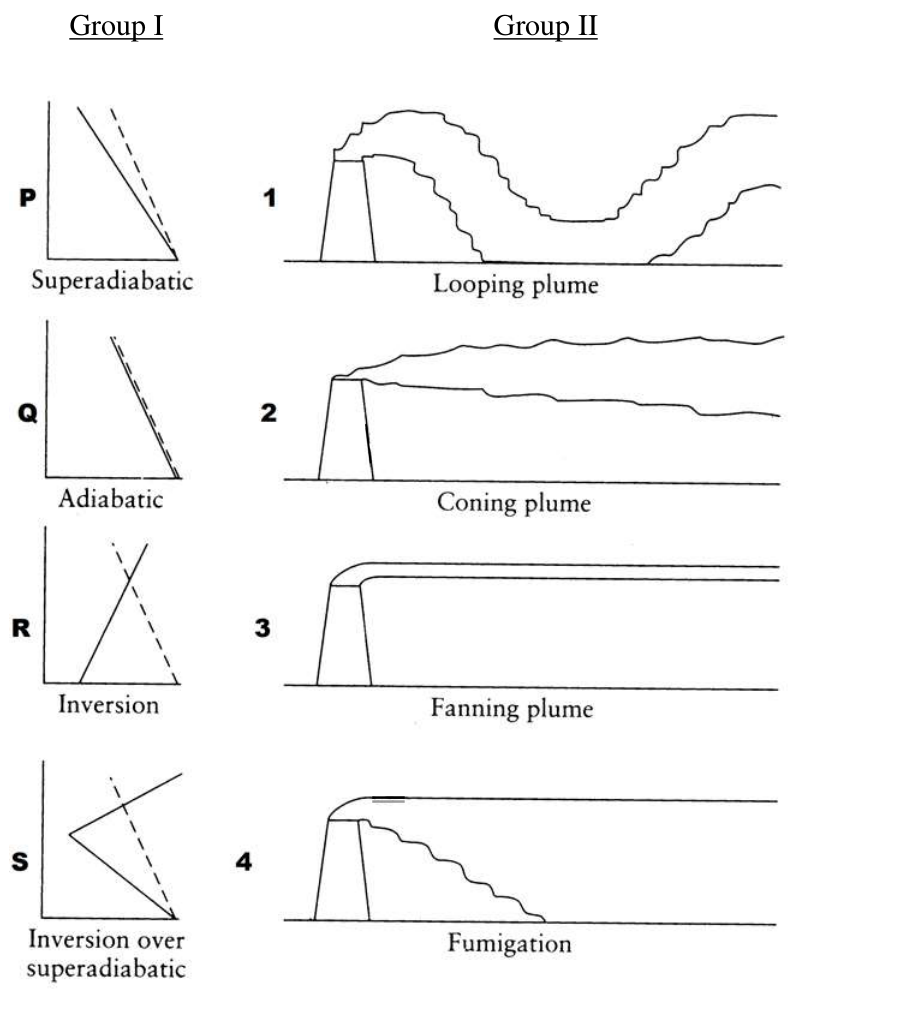
Group I shows atmospheric temperature profiles P, Q, R, S; Group II shows smoke-stack plume patterns 1–4. In Group I, dashed lines show the dry adiabatic lapse rate; horizontal and vertical axes denote temperature and altitude. Match the groups.
Practise this question in The GATE Grind →
Show answer and explanation
Correct answer: (A) P–1, Q–2, R–3, S–4
Explanation
Superadiabatic unstable air produces looping (P→1). Neutral adiabatic conditions give coning (Q→2). A temperature inversion suppresses vertical motion and gives fanning (R→3). An inversion above unstable lower air traps upward dispersion and promotes fumigation (S→4). Thus **A**.