GATE 2024 EC – Question 22
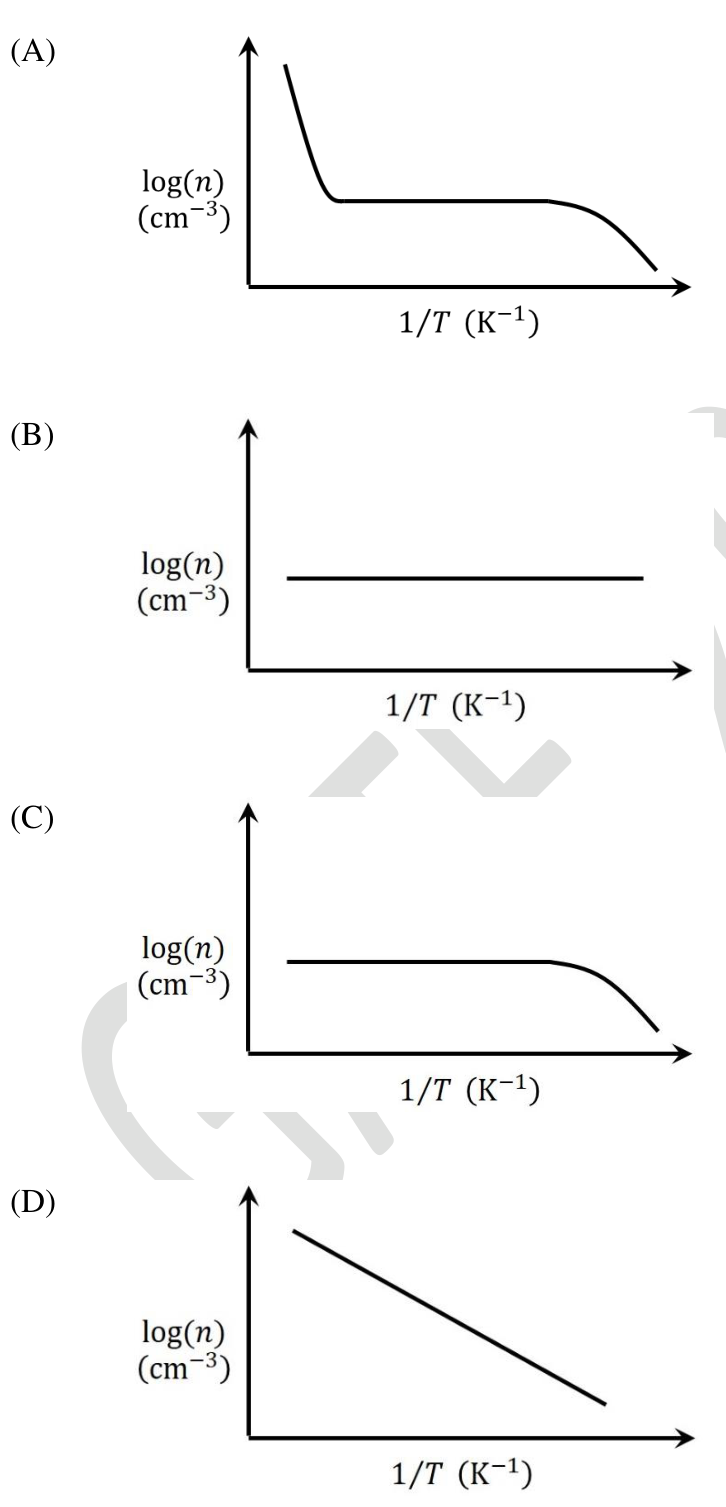
For non-degenerately doped n-type silicon, which one of the following plots represents the temperature ($T$) dependence of free electron concentration ($n$)?
Practise this question in The GATE Grind →
Show answer and explanation
Correct answer: (A) Plot (A)
Explanation
Plotted as $\log n$ against $1/T$ there are three regions. At low temperature (large $1/T$) donors are only partly ionised (freeze-out), so $n$ falls as $1/T$ increases. In the middle range all donors are ionised and $n\approx N_D$ is flat. At high temperature (small $1/T$) intrinsic carriers dominate and $n$ rises steeply. Only plot (A) has all three regions in the right order.