GATE 2014 EC (EC4) – Question 19
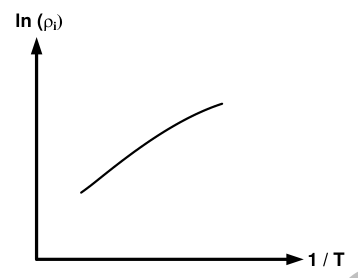
The figure plots $\ln\rho_i$ against 1/T for silicon intrinsic resistivity $\rho_i$ and temperature T. The plot is almost linear. What can its slope estimate?
Practise this question in The GATE Grind →
Show answer and explanation
Correct answer: (A) Silicon bandgap energy E_g
Explanation
Intrinsic carrier concentration contains exp(−Eg/2kT), and resistivity is inversely proportional to intrinsic conductivity. To leading exponential order lnρi≈constant+Eg/(2kT). Thus a plot against1/T has slope approximately Eg/(2k), enabling estimation of **silicon bandgap energy,A**. Mobility and temperature-power factors give slower corrections.