GATE 2014 EC (EC4) – Question 46
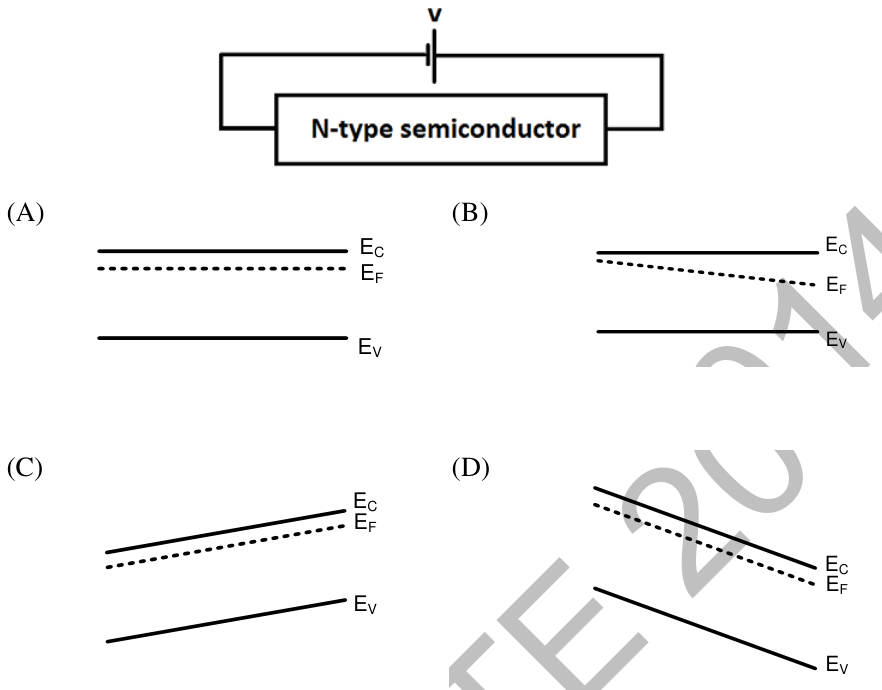
A uniformly doped N-type semiconductor is biased as shown. E_C is the conduction-band minimum, E_V the valence-band maximum and E_F the Fermi level. Which diagram represents the energy bands?
Practise this question in The GATE Grind →
Show answer and explanation
Correct answer: (D) Diagram D
Explanation
The right contact is at higher electric potential. Electron band energies shift as−qφ, so both conduction and valence band edges slope downward toward the right. Uniform doping keeps their separation and the electron quasi-Fermi-level offset approximately constant. This matches **D**, rather than flat bands or an upward slope.