GATE 2024 EE – Question 8
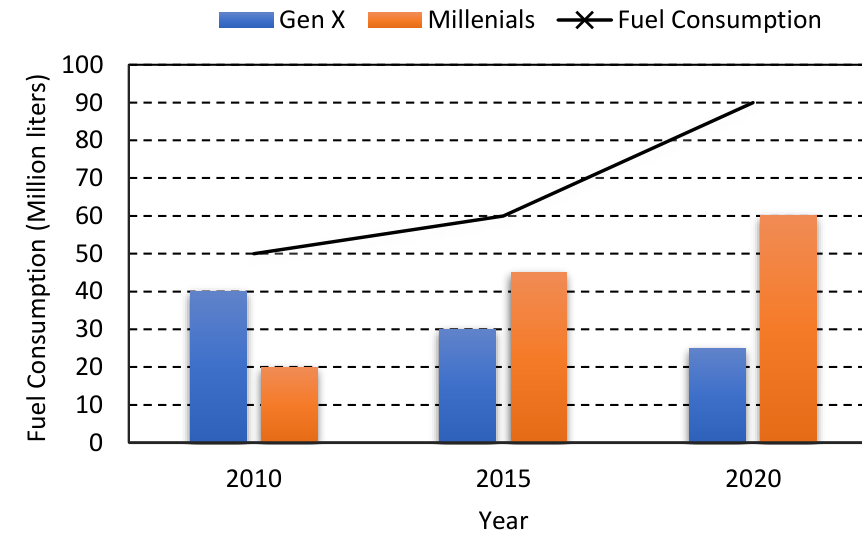
The chart below shows the data of the number of cars bought by Millennials and Gen X people in a country from the year 2010 to 2020 as well as the yearly fuel consumption of the country (in Million liters).
Considering the data presented in the chart, which one of the following options is true?
Practise this question in The GATE Grind →
Show answer and explanation
Correct answer: (C) The increase in the number of Millennial car buyers from 2010 to 2015 is more than the decrease in the number of Gen X car buyers from 2010 to 2015.
Explanation
Reading the chart: fuel is 50, 60, 90 (million litres) in 2010, 2015, 2020; Gen X buyers are 40k, 30k, 25k; Millennial buyers are 20k, 45k, 60k. (A) 20% vs 50%: false. (B) Millennial rise 2015–20 is 15k, Gen X fall 2010–15 is 10k, so "less" is false. (C) Millennial rise 2010–15 is 25k and Gen X fall 2010–15 is 10k: true. (D) Gen X fall 2015–20 is 5k, not more than 25k: false.