GATE 2015 CS (CS3) – Question 8
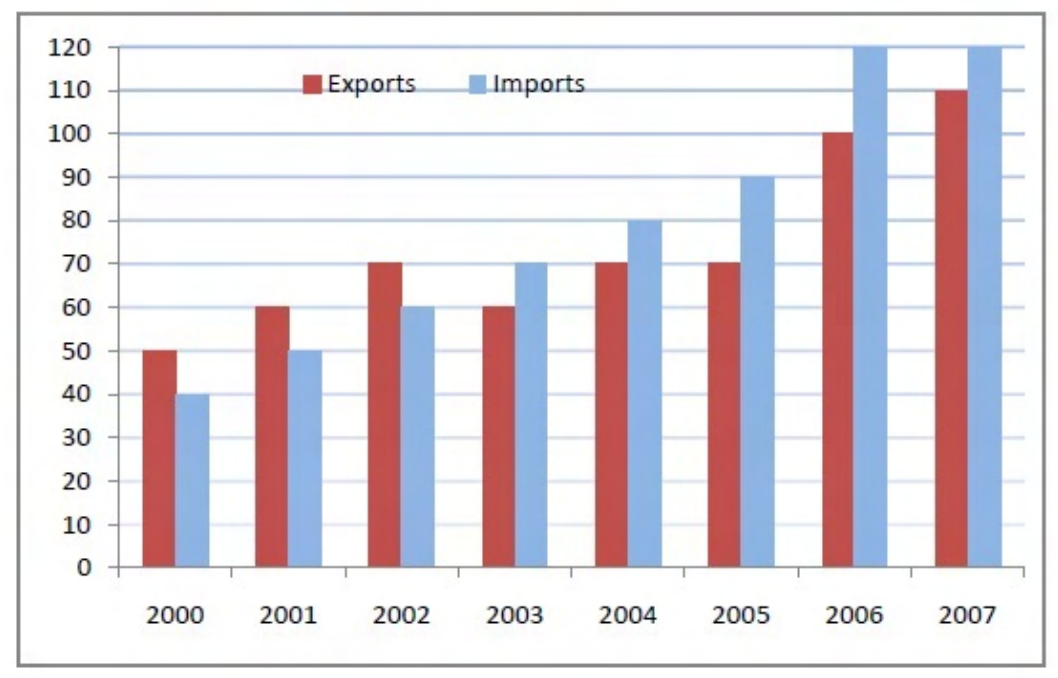
The chart shows annual exports and imports in crores of rupees from 2000 to 2007. In which year was the combined percentage increase in imports and exports over the preceding year highest?
Practise this question in The GATE Grind →
Show answer and explanation
Correct answer: 2006
Explanation
The export-plus-import totals are 90,110,130,130,150,160,220,230. Their successive percentage rises are about 22.22%,18.18%,0%,15.38%,6.67%,37.5%,4.55%. The largest is the rise from 160 to 220, in 2006. The year 2000 has no preceding-year data in the chart.
More Quantitative Aptitude: Data Interpretation, Arithmetic and Number Computation questions
- GATE 2021 CS (CS2) Q9
- GATE 2026 CS (CS1) Q3
- GATE 2026 CS (CS1) Q4
- GATE 2026 CS (CS1) Q8
- GATE 2026 CS (CS1) Q10
- GATE 2026 CS (CS2) Q3
All Quantitative Aptitude: Data Interpretation, Arithmetic and Number Computation questions →